Bhutanese Wage/Income Gap
COMPARE
Bhutanese
Select to Compare
Wage/Income Gap
Bhutanese Wage/Income Gap
27.0%
WAGE/INCOME GAP
5.3/ 100
METRIC RATING
231st/ 347
METRIC RANK
Bhutanese Wage/Income Gap Correlation Chart
The statistical analysis conducted on geographies consisting of 455,138,655 people shows a poor negative correlation between the proportion of Bhutanese and wage/income gap percentage in the United States with a correlation coefficient (R) of -0.153 and weighted average of 27.0%. On average, for every 1% (one percent) increase in Bhutanese within a typical geography, there is a decrease of 0.11% in wage/income gap percentage.
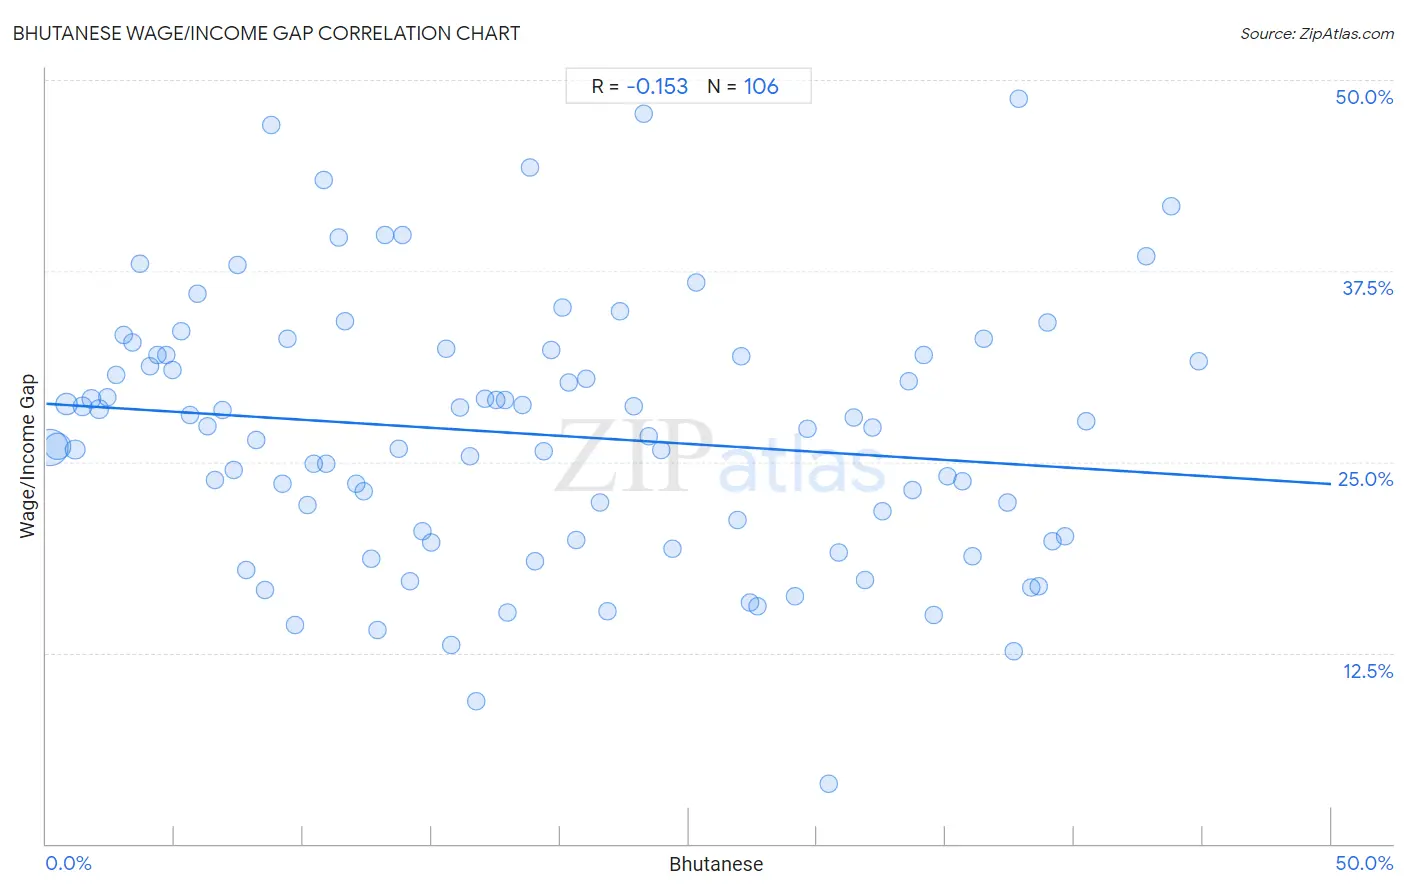
It is essential to understand that the correlation between the percentage of Bhutanese and wage/income gap percentage does not imply a direct cause-and-effect relationship. It remains uncertain whether the presence of Bhutanese influences an upward or downward trend in the level of wage/income gap percentage within an area, or if Bhutanese simply ended up residing in those areas with higher or lower levels of wage/income gap percentage due to other factors.
Demographics Similar to Bhutanese by Wage/Income Gap
In terms of wage/income gap, the demographic groups most similar to Bhutanese are Argentinean (27.0%, a difference of 0.020%), Ottawa (27.0%, a difference of 0.030%), Immigrants from Asia (27.0%, a difference of 0.070%), Immigrants from Brazil (27.0%, a difference of 0.080%), and Spaniard (27.0%, a difference of 0.11%).
| Demographics | Rating | Rank | Wage/Income Gap |
| Immigrants from Argentina | 7.2 /100 | #224 | Tragic 26.8% |
| Immigrants from Ireland | 6.5 /100 | #225 | Tragic 26.9% |
| Asians | 5.9 /100 | #226 | Tragic 26.9% |
| Spaniards | 5.6 /100 | #227 | Tragic 27.0% |
| Immigrants from Turkey | 5.6 /100 | #228 | Tragic 27.0% |
| Immigrants from Asia | 5.5 /100 | #229 | Tragic 27.0% |
| Ottawa | 5.3 /100 | #230 | Tragic 27.0% |
| Bhutanese | 5.3 /100 | #231 | Tragic 27.0% |
| Argentineans | 5.2 /100 | #232 | Tragic 27.0% |
| Immigrants from Brazil | 5.0 /100 | #233 | Tragic 27.0% |
| Immigrants from Pakistan | 4.9 /100 | #234 | Tragic 27.0% |
| Immigrants from Hungary | 4.8 /100 | #235 | Tragic 27.0% |
| Immigrants from Romania | 4.8 /100 | #236 | Tragic 27.0% |
| Immigrants from Eastern Asia | 4.4 /100 | #237 | Tragic 27.1% |
| Osage | 4.4 /100 | #238 | Tragic 27.1% |
Bhutanese Wage/Income Gap Correlation Summary
| Measurement | Bhutanese Data | Wage/Income Gap Data |
| Minimum | 0.15% | 3.9% |
| Maximum | 44.8% | 48.8% |
| Range | 44.7% | 44.9% |
| Mean | 18.9% | 26.8% |
| Median | 17.3% | 27.2% |
| Interquartile 25% (IQ1) | 8.5% | 20.1% |
| Interquartile 75% (IQ3) | 29.6% | 32.0% |
| Interquartile Range (IQR) | 21.1% | 11.9% |
| Standard Deviation (Sample) | 12.4% | 8.5% |
| Standard Deviation (Population) | 12.3% | 8.5% |
Correlation Details
| Bhutanese Percentile | Sample Size | Wage/Income Gap |
[ 0.0% - 0.5% ] 0.15% | 234,343,312 | 25.9% |
[ 0.0% - 0.5% ] 0.45% | 107,607,651 | 26.1% |
[ 0.5% - 1.0% ] 0.79% | 39,878,170 | 28.8% |
[ 1.0% - 1.5% ] 1.11% | 26,479,910 | 25.8% |
[ 1.0% - 1.5% ] 1.42% | 13,519,881 | 28.7% |
[ 1.5% - 2.0% ] 1.75% | 10,859,180 | 29.1% |
[ 2.0% - 2.5% ] 2.06% | 6,198,318 | 28.5% |
[ 2.0% - 2.5% ] 2.36% | 4,681,640 | 29.2% |
[ 2.5% - 3.0% ] 2.73% | 2,629,071 | 30.7% |
[ 3.0% - 3.5% ] 3.03% | 1,541,542 | 33.3% |
[ 3.0% - 3.5% ] 3.35% | 1,248,682 | 32.8% |
[ 3.5% - 4.0% ] 3.64% | 904,305 | 38.0% |
[ 4.0% - 4.5% ] 4.02% | 113,399 | 31.2% |
[ 4.0% - 4.5% ] 4.31% | 621,947 | 32.0% |
[ 4.5% - 5.0% ] 4.68% | 164,525 | 32.0% |
[ 4.5% - 5.0% ] 4.93% | 283,137 | 31.0% |
[ 5.0% - 5.5% ] 5.26% | 157,742 | 33.6% |
[ 5.5% - 6.0% ] 5.59% | 165,900 | 28.1% |
[ 5.5% - 6.0% ] 5.87% | 34,821 | 36.0% |
[ 6.0% - 6.5% ] 6.26% | 98,663 | 27.4% |
[ 6.5% - 7.0% ] 6.54% | 105,826 | 23.8% |
[ 6.5% - 7.0% ] 6.85% | 34,515 | 28.4% |
[ 7.0% - 7.5% ] 7.27% | 54,288 | 24.5% |
[ 7.0% - 7.5% ] 7.43% | 66,296 | 37.9% |
[ 7.5% - 8.0% ] 7.78% | 45,374 | 17.9% |
[ 8.0% - 8.5% ] 8.19% | 37,257 | 26.4% |
[ 8.5% - 9.0% ] 8.51% | 73,568 | 16.6% |
[ 8.5% - 9.0% ] 8.77% | 21,057 | 47.1% |
[ 9.0% - 9.5% ] 9.21% | 149,035 | 23.5% |
[ 9.0% - 9.5% ] 9.40% | 58,328 | 33.0% |
[ 9.5% - 10.0% ] 9.69% | 49,914 | 14.3% |
[ 10.0% - 10.5% ] 10.15% | 35,826 | 22.1% |
[ 10.0% - 10.5% ] 10.41% | 100,286 | 24.9% |
[ 10.5% - 11.0% ] 10.80% | 109,561 | 43.4% |
[ 10.5% - 11.0% ] 10.91% | 2,384 | 24.9% |
[ 11.0% - 11.5% ] 11.40% | 51,425 | 39.7% |
[ 11.5% - 12.0% ] 11.64% | 28,560 | 34.2% |
[ 12.0% - 12.5% ] 12.08% | 44,828 | 23.6% |
[ 12.0% - 12.5% ] 12.35% | 69,323 | 23.1% |
[ 12.5% - 13.0% ] 12.62% | 63,452 | 18.6% |
[ 12.5% - 13.0% ] 12.90% | 22,560 | 14.0% |
[ 13.0% - 13.5% ] 13.19% | 9,534 | 39.8% |
[ 13.5% - 14.0% ] 13.72% | 170,527 | 25.8% |
[ 13.5% - 14.0% ] 13.85% | 917 | 39.8% |
[ 14.0% - 14.5% ] 14.13% | 73,188 | 17.2% |
[ 14.5% - 15.0% ] 14.62% | 21,247 | 20.5% |
[ 14.5% - 15.0% ] 14.98% | 14,299 | 19.7% |
[ 15.5% - 16.0% ] 15.55% | 29,771 | 32.4% |
[ 15.5% - 16.0% ] 15.78% | 12,785 | 13.0% |
[ 16.0% - 16.5% ] 16.12% | 78,014 | 28.5% |
[ 16.0% - 16.5% ] 16.47% | 16,263 | 25.4% |
[ 16.5% - 17.0% ] 16.75% | 3,386 | 9.4% |
[ 17.0% - 17.5% ] 17.05% | 49,187 | 29.1% |
[ 17.0% - 17.5% ] 17.49% | 142,903 | 29.0% |
[ 17.5% - 18.0% ] 17.86% | 52,772 | 29.0% |
[ 17.5% - 18.0% ] 17.96% | 3,553 | 15.1% |
[ 18.5% - 19.0% ] 18.51% | 16,703 | 28.8% |
[ 18.5% - 19.0% ] 18.82% | 7,498 | 44.2% |
[ 19.0% - 19.5% ] 19.02% | 105,792 | 18.5% |
[ 19.0% - 19.5% ] 19.37% | 28,551 | 25.7% |
[ 19.5% - 20.0% ] 19.63% | 36,642 | 32.3% |
[ 20.0% - 20.5% ] 20.07% | 58,985 | 35.1% |
[ 20.0% - 20.5% ] 20.31% | 11,522 | 30.2% |
[ 20.5% - 21.0% ] 20.64% | 29,516 | 19.9% |
[ 20.5% - 21.0% ] 21.00% | 25,000 | 30.4% |
[ 21.5% - 22.0% ] 21.53% | 17,604 | 22.3% |
[ 21.5% - 22.0% ] 21.84% | 38,891 | 15.2% |
[ 22.0% - 22.5% ] 22.30% | 20,473 | 34.8% |
[ 22.5% - 23.0% ] 22.85% | 15,911 | 28.7% |
[ 23.0% - 23.5% ] 23.24% | 340 | 47.8% |
[ 23.0% - 23.5% ] 23.44% | 62,481 | 26.7% |
[ 23.5% - 24.0% ] 23.94% | 32,036 | 25.8% |
[ 24.0% - 24.5% ] 24.39% | 21,592 | 19.3% |
[ 25.0% - 25.5% ] 25.30% | 577 | 36.7% |
[ 26.5% - 27.0% ] 26.89% | 348,547 | 21.2% |
[ 27.0% - 27.5% ] 27.06% | 6,246 | 31.9% |
[ 27.0% - 27.5% ] 27.40% | 24,520 | 15.8% |
[ 27.5% - 28.0% ] 27.69% | 2,438 | 15.6% |
[ 29.0% - 29.5% ] 29.12% | 30,068 | 16.2% |
[ 29.5% - 30.0% ] 29.60% | 8,649 | 27.1% |
[ 30.0% - 30.5% ] 30.46% | 2,896 | 3.9% |
[ 30.5% - 31.0% ] 30.85% | 50,453 | 19.1% |
[ 31.0% - 31.5% ] 31.40% | 981 | 27.9% |
[ 31.5% - 32.0% ] 31.87% | 47,627 | 17.2% |
[ 32.0% - 32.5% ] 32.13% | 22,723 | 27.2% |
[ 32.5% - 33.0% ] 32.52% | 3,887 | 21.8% |
[ 33.5% - 34.0% ] 33.55% | 25,957 | 30.3% |
[ 33.5% - 34.0% ] 33.73% | 2,188 | 23.1% |
[ 34.0% - 34.5% ] 34.12% | 25,771 | 32.0% |
[ 34.5% - 35.0% ] 34.53% | 55,402 | 15.0% |
[ 35.0% - 35.5% ] 35.08% | 13,932 | 24.1% |
[ 35.5% - 36.0% ] 35.67% | 45,038 | 23.7% |
[ 36.0% - 36.5% ] 36.04% | 55,888 | 18.8% |
[ 36.0% - 36.5% ] 36.47% | 34,001 | 33.0% |
[ 37.0% - 37.5% ] 37.43% | 9,571 | 22.4% |
[ 37.5% - 38.0% ] 37.65% | 50,976 | 12.6% |
[ 37.5% - 38.0% ] 37.83% | 3,902 | 48.8% |
[ 38.0% - 38.5% ] 38.32% | 51,598 | 16.7% |
[ 38.5% - 39.0% ] 38.62% | 35,493 | 16.9% |
[ 38.5% - 39.0% ] 38.98% | 49,491 | 34.1% |
[ 39.0% - 39.5% ] 39.14% | 41,560 | 19.8% |
[ 39.5% - 40.0% ] 39.65% | 29,490 | 20.1% |
[ 40.0% - 40.5% ] 40.46% | 54,362 | 27.6% |
[ 42.5% - 43.0% ] 42.78% | 18,802 | 38.5% |
[ 43.5% - 44.0% ] 43.79% | 733 | 41.8% |
[ 44.5% - 45.0% ] 44.83% | 21,546 | 31.6% |