Bhutanese Married-couple Households
COMPARE
Bhutanese
Select to Compare
Married-couple Households
Bhutanese Married-couple Households
49.3%
MARRIED-COUPLE HOUSEHOLDS
99.8/ 100
METRIC RATING
27th/ 347
METRIC RANK
Bhutanese Married-couple Households Correlation Chart
The statistical analysis conducted on geographies consisting of 455,135,047 people shows a poor negative correlation between the proportion of Bhutanese and percentage of married-couple family households in the United States with a correlation coefficient (R) of -0.103 and weighted average of 49.3%. On average, for every 1% (one percent) increase in Bhutanese within a typical geography, there is a decrease of 0.070% in percentage of married-couple family households.
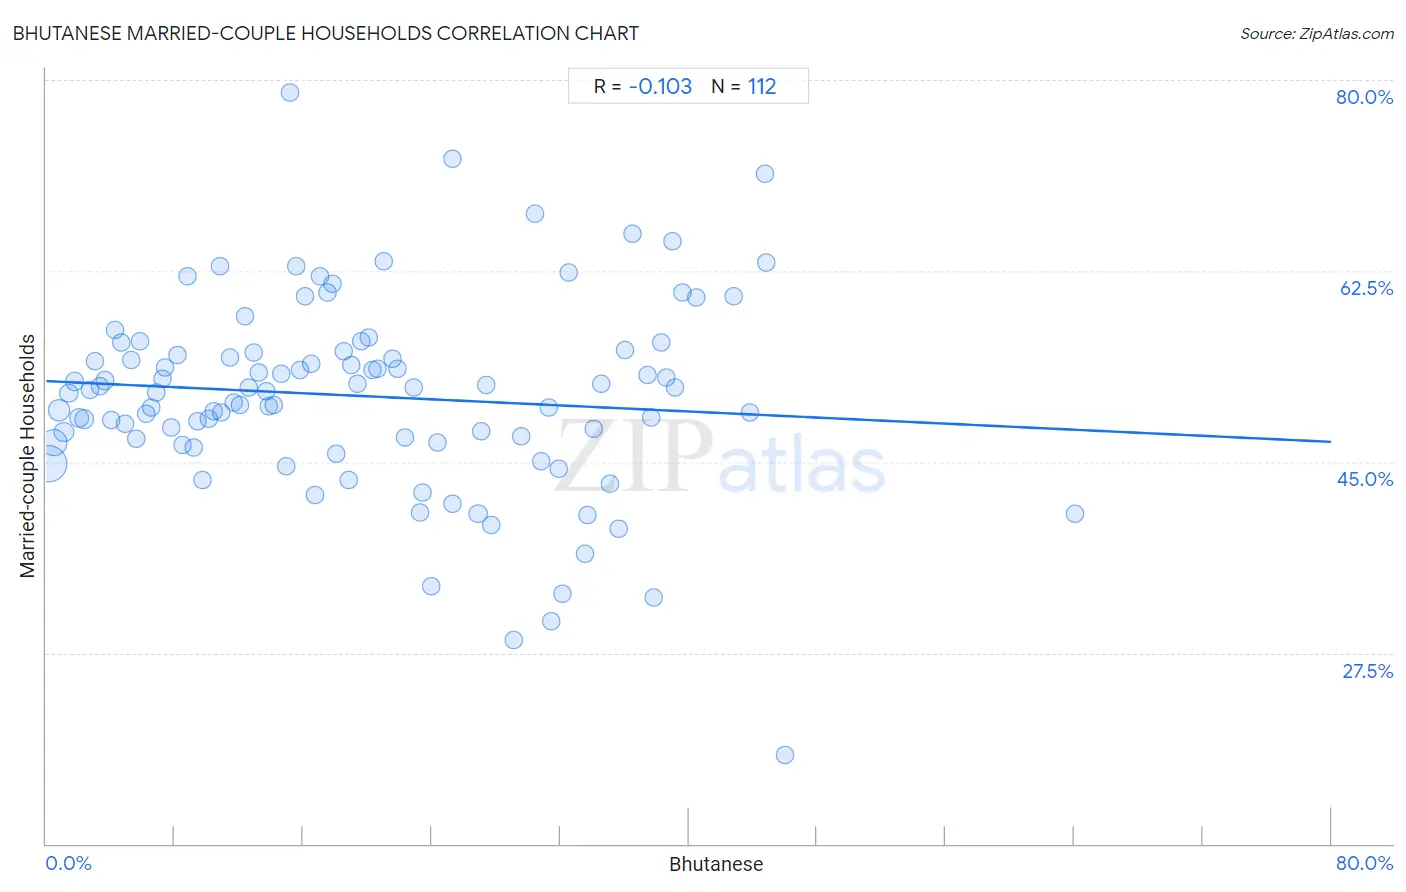
It is essential to understand that the correlation between the percentage of Bhutanese and percentage of married-couple family households does not imply a direct cause-and-effect relationship. It remains uncertain whether the presence of Bhutanese influences an upward or downward trend in the level of percentage of married-couple family households within an area, or if Bhutanese simply ended up residing in those areas with higher or lower levels of percentage of married-couple family households due to other factors.
Demographics Similar to Bhutanese by Married-couple Households
In terms of married-couple households, the demographic groups most similar to Bhutanese are Immigrants from Scotland (49.3%, a difference of 0.020%), Immigrants from Philippines (49.3%, a difference of 0.15%), German (49.2%, a difference of 0.19%), Maltese (49.2%, a difference of 0.20%), and Bolivian (49.2%, a difference of 0.21%).
| Demographics | Rating | Rank | Married-couple Households |
| Scandinavians | 99.9 /100 | #20 | Exceptional 49.6% |
| Norwegians | 99.9 /100 | #21 | Exceptional 49.5% |
| Asians | 99.9 /100 | #22 | Exceptional 49.5% |
| Dutch | 99.9 /100 | #23 | Exceptional 49.5% |
| Czechs | 99.9 /100 | #24 | Exceptional 49.4% |
| Immigrants from Philippines | 99.9 /100 | #25 | Exceptional 49.3% |
| Immigrants from Scotland | 99.8 /100 | #26 | Exceptional 49.3% |
| Bhutanese | 99.8 /100 | #27 | Exceptional 49.3% |
| Germans | 99.8 /100 | #28 | Exceptional 49.2% |
| Maltese | 99.8 /100 | #29 | Exceptional 49.2% |
| Bolivians | 99.8 /100 | #30 | Exceptional 49.2% |
| Native Hawaiians | 99.8 /100 | #31 | Exceptional 49.1% |
| Hungarians | 99.8 /100 | #32 | Exceptional 49.1% |
| Immigrants from Asia | 99.7 /100 | #33 | Exceptional 49.1% |
| Italians | 99.7 /100 | #34 | Exceptional 49.0% |
Bhutanese Married-couple Households Correlation Summary
| Measurement | Bhutanese Data | Married-couple Households Data |
| Minimum | 0.15% | 18.2% |
| Maximum | 64.0% | 78.9% |
| Range | 63.9% | 60.7% |
| Mean | 19.9% | 51.0% |
| Median | 18.0% | 51.5% |
| Interquartile 25% (IQ1) | 9.0% | 47.0% |
| Interquartile 75% (IQ3) | 31.1% | 55.1% |
| Interquartile Range (IQR) | 22.1% | 8.1% |
| Standard Deviation (Sample) | 13.3% | 9.0% |
| Standard Deviation (Population) | 13.2% | 9.0% |
Correlation Details
| Bhutanese Percentile | Sample Size | Married-couple Households |
[ 0.0% - 0.5% ] 0.15% | 234,311,110 | 44.9% |
[ 0.0% - 0.5% ] 0.45% | 107,574,983 | 46.8% |
[ 0.5% - 1.0% ] 0.79% | 39,882,603 | 49.7% |
[ 1.0% - 1.5% ] 1.11% | 26,463,474 | 47.7% |
[ 1.0% - 1.5% ] 1.42% | 13,498,911 | 51.3% |
[ 1.5% - 2.0% ] 1.75% | 10,877,943 | 52.4% |
[ 2.0% - 2.5% ] 2.06% | 6,208,531 | 49.0% |
[ 2.0% - 2.5% ] 2.36% | 4,689,622 | 48.9% |
[ 2.5% - 3.0% ] 2.73% | 2,637,393 | 51.6% |
[ 3.0% - 3.5% ] 3.03% | 1,543,195 | 54.2% |
[ 3.0% - 3.5% ] 3.35% | 1,249,940 | 51.9% |
[ 3.5% - 4.0% ] 3.64% | 906,608 | 52.5% |
[ 4.0% - 4.5% ] 4.03% | 112,858 | 48.9% |
[ 4.0% - 4.5% ] 4.31% | 625,863 | 57.1% |
[ 4.5% - 5.0% ] 4.68% | 169,752 | 55.9% |
[ 4.5% - 5.0% ] 4.93% | 286,103 | 48.5% |
[ 5.0% - 5.5% ] 5.26% | 160,283 | 54.3% |
[ 5.5% - 6.0% ] 5.59% | 168,199 | 47.2% |
[ 5.5% - 6.0% ] 5.87% | 36,963 | 56.1% |
[ 6.0% - 6.5% ] 6.26% | 98,962 | 49.4% |
[ 6.5% - 7.0% ] 6.55% | 105,207 | 50.0% |
[ 6.5% - 7.0% ] 6.86% | 36,498 | 51.3% |
[ 7.0% - 7.5% ] 7.27% | 56,821 | 52.6% |
[ 7.0% - 7.5% ] 7.43% | 66,817 | 53.7% |
[ 7.5% - 8.0% ] 7.78% | 44,102 | 48.2% |
[ 8.0% - 8.5% ] 8.19% | 39,291 | 54.8% |
[ 8.5% - 9.0% ] 8.51% | 79,097 | 46.6% |
[ 8.5% - 9.0% ] 8.78% | 22,696 | 62.1% |
[ 9.0% - 9.5% ] 9.21% | 149,473 | 46.3% |
[ 9.0% - 9.5% ] 9.40% | 58,328 | 48.7% |
[ 9.5% - 10.0% ] 9.69% | 50,021 | 43.4% |
[ 10.0% - 10.5% ] 10.15% | 36,641 | 49.0% |
[ 10.0% - 10.5% ] 10.41% | 101,164 | 49.6% |
[ 10.5% - 11.0% ] 10.80% | 109,561 | 62.9% |
[ 10.5% - 11.0% ] 10.91% | 3,418 | 49.5% |
[ 11.0% - 11.5% ] 11.40% | 51,425 | 54.6% |
[ 11.5% - 12.0% ] 11.64% | 29,059 | 50.5% |
[ 12.0% - 12.5% ] 12.08% | 44,828 | 50.2% |
[ 12.0% - 12.5% ] 12.35% | 69,533 | 58.3% |
[ 12.5% - 13.0% ] 12.62% | 63,452 | 51.8% |
[ 12.5% - 13.0% ] 12.90% | 22,560 | 55.1% |
[ 13.0% - 13.5% ] 13.19% | 9,534 | 53.2% |
[ 13.5% - 14.0% ] 13.72% | 172,306 | 51.5% |
[ 13.5% - 14.0% ] 13.83% | 1,555 | 50.1% |
[ 14.0% - 14.5% ] 14.13% | 73,593 | 50.2% |
[ 14.5% - 15.0% ] 14.62% | 21,492 | 53.0% |
[ 14.5% - 15.0% ] 14.98% | 14,299 | 44.6% |
[ 15.0% - 15.5% ] 15.18% | 560 | 78.9% |
[ 15.5% - 16.0% ] 15.55% | 30,266 | 62.9% |
[ 15.5% - 16.0% ] 15.78% | 12,885 | 53.5% |
[ 16.0% - 16.5% ] 16.12% | 78,014 | 60.2% |
[ 16.0% - 16.5% ] 16.47% | 16,263 | 54.0% |
[ 16.5% - 17.0% ] 16.75% | 3,386 | 41.9% |
[ 17.0% - 17.5% ] 17.05% | 49,187 | 62.1% |
[ 17.0% - 17.5% ] 17.49% | 142,903 | 60.5% |
[ 17.5% - 18.0% ] 17.86% | 52,772 | 61.4% |
[ 18.0% - 18.5% ] 18.05% | 5,817 | 45.7% |
[ 18.5% - 19.0% ] 18.51% | 16,703 | 55.2% |
[ 18.5% - 19.0% ] 18.82% | 7,498 | 43.4% |
[ 19.0% - 19.5% ] 19.02% | 105,792 | 53.9% |
[ 19.0% - 19.5% ] 19.37% | 28,551 | 52.1% |
[ 19.5% - 20.0% ] 19.63% | 36,642 | 56.0% |
[ 20.0% - 20.5% ] 20.07% | 58,985 | 56.5% |
[ 20.0% - 20.5% ] 20.31% | 11,522 | 53.5% |
[ 20.5% - 21.0% ] 20.64% | 30,022 | 53.6% |
[ 20.5% - 21.0% ] 21.00% | 25,000 | 63.4% |
[ 21.5% - 22.0% ] 21.53% | 17,604 | 54.4% |
[ 21.5% - 22.0% ] 21.84% | 38,891 | 53.5% |
[ 22.0% - 22.5% ] 22.30% | 20,473 | 47.2% |
[ 22.5% - 23.0% ] 22.85% | 15,911 | 51.8% |
[ 23.0% - 23.5% ] 23.23% | 495 | 40.3% |
[ 23.0% - 23.5% ] 23.44% | 62,481 | 42.2% |
[ 23.5% - 24.0% ] 23.94% | 32,036 | 33.6% |
[ 24.0% - 24.5% ] 24.39% | 21,592 | 46.7% |
[ 25.0% - 25.5% ] 25.26% | 289 | 41.1% |
[ 25.0% - 25.5% ] 25.30% | 577 | 72.7% |
[ 26.5% - 27.0% ] 26.89% | 348,547 | 40.3% |
[ 27.0% - 27.5% ] 27.06% | 6,246 | 47.8% |
[ 27.0% - 27.5% ] 27.40% | 24,520 | 52.1% |
[ 27.5% - 28.0% ] 27.69% | 2,438 | 39.2% |
[ 29.0% - 29.5% ] 29.12% | 30,068 | 28.6% |
[ 29.5% - 30.0% ] 29.60% | 8,649 | 47.4% |
[ 30.0% - 30.5% ] 30.46% | 2,896 | 67.7% |
[ 30.5% - 31.0% ] 30.85% | 50,453 | 45.0% |
[ 31.0% - 31.5% ] 31.28% | 227 | 50.0% |
[ 31.0% - 31.5% ] 31.45% | 1,313 | 30.4% |
[ 31.5% - 32.0% ] 31.87% | 47,627 | 44.4% |
[ 32.0% - 32.5% ] 32.13% | 22,723 | 32.9% |
[ 32.5% - 33.0% ] 32.52% | 3,887 | 62.4% |
[ 33.5% - 34.0% ] 33.55% | 25,957 | 36.6% |
[ 33.5% - 34.0% ] 33.73% | 2,188 | 40.1% |
[ 34.0% - 34.5% ] 34.12% | 25,771 | 48.1% |
[ 34.5% - 35.0% ] 34.53% | 55,402 | 52.1% |
[ 35.0% - 35.5% ] 35.08% | 13,932 | 43.0% |
[ 35.5% - 36.0% ] 35.67% | 45,038 | 38.9% |
[ 36.0% - 36.5% ] 36.04% | 55,888 | 55.3% |
[ 36.0% - 36.5% ] 36.47% | 34,001 | 65.9% |
[ 37.0% - 37.5% ] 37.43% | 9,571 | 53.0% |
[ 37.5% - 38.0% ] 37.65% | 50,976 | 49.1% |
[ 37.5% - 38.0% ] 37.83% | 3,902 | 32.5% |
[ 38.0% - 38.5% ] 38.32% | 51,598 | 55.9% |
[ 38.5% - 39.0% ] 38.62% | 35,493 | 52.7% |
[ 38.5% - 39.0% ] 38.98% | 49,491 | 65.2% |
[ 39.0% - 39.5% ] 39.14% | 41,748 | 51.8% |
[ 39.5% - 40.0% ] 39.65% | 29,490 | 60.5% |
[ 40.0% - 40.5% ] 40.46% | 54,362 | 60.1% |
[ 42.5% - 43.0% ] 42.78% | 18,802 | 60.2% |
[ 43.5% - 44.0% ] 43.79% | 733 | 49.6% |
[ 44.5% - 45.0% ] 44.74% | 38 | 71.4% |
[ 44.5% - 45.0% ] 44.83% | 21,546 | 63.3% |
[ 46.0% - 46.5% ] 46.00% | 50 | 18.2% |
[ 64.0% - 64.5% ] 64.04% | 292 | 40.3% |