Alaska Native Married-Couple Family Poverty

COMPARE

Alaska Native
Race
Ancestry
AfghanAfricanAlaska NativeAlaskan AthabascanAlbanianAleutAlsatianAmericanApacheArabArapahoArgentineanArmenianAssyrian/Chaldean/SyriacAustralianAustrianBahamianBangladeshiBarbadianBasqueBelgianBelizeanBermudanBhutaneseBlackfeetBolivianBrazilianBritishBritish West IndianBulgarianBurmeseCajunCambodianCanadianCape VerdeanCarpatho RusynCelticCentral AmericanCentral American IndianCherokeeCheyenneChickasawChileanChineseChippewaChoctawColombianColvilleComancheCosta RicanCreeCreekCroatianCrowCubanCypriotCzechCzechoslovakianDanishDelawareDominicanDutchDutch West IndianEastern EuropeanEcuadorianEgyptianEnglishEstonianEthiopianEuropeanFijianFilipinoFinnishFrenchFrench American IndianFrench CanadianGermanGerman RussianGhanaianGreekGuamanian/ChamorroGuatemalanGuyaneseHaitianHmongHonduranHopiHoumaHungarianIcelanderIndian (Asian)IndonesianInupiatIranianIraqiIrishIroquoisIsraeliItalianJamaicanJapaneseJordanianKenyanKiowaKoreanLaotianLatvianLebaneseLiberianLithuanianLumbeeLuxembourgerMacedonianMalaysianMalteseMarshalleseMenomineeMexicanMexican American IndianMongolianMoroccanNative HawaiianNavajoNepaleseNew ZealanderNicaraguanNigerianNorthern EuropeanNorwegianOkinawanOsageOttawaPaiutePakistaniPalestinianPanamanianParaguayanPennsylvania GermanPeruvianPimaPolishPortuguesePotawatomiPuebloPuerto RicanPuget Sound SalishRomanianRussianSalvadoranSamoanScandinavianScotch-IrishScottishSeminoleSenegaleseSerbianShoshoneSierra LeoneanSiouxSlavicSlovakSloveneSomaliSouth AfricanSouth AmericanSouth American IndianSoviet UnionSpaniardSpanishSpanish AmericanSpanish American IndianSri LankanSubsaharan AfricanSudaneseSwedishSwissSyrianTaiwaneseThaiTlingit-HaidaTohono O'OdhamTonganTrinidadian and TobagonianTsimshianTurkishU.S. Virgin IslanderUgandanUkrainianUruguayanUteVenezuelanVietnameseWelshWest IndianYakamaYaquiYugoslavianYumanYup'ikZimbabwean
Immigration
NonimmigrantsImmigrantsAfghanistanAfricaAlbaniaArgentinaArmeniaAsiaAustraliaAustriaBahamasBangladeshBarbadosBelarusBelgiumBelizeBoliviaBosnia and HerzegovinaBrazilBulgariaBurma/MyanmarCabo VerdeCambodiaCameroonCanadaCaribbeanCentral AmericaChileChinaColombiaCongoCosta RicaCroatiaCubaCzechoslovakiaDenmarkDominicaDominican RepublicEastern AfricaEastern AsiaEastern EuropeEcuadorEgyptEl SalvadorEnglandEritreaEthiopiaEuropeFijiFranceGermanyGhanaGreeceGrenadaGuatemalaGuyanaHaitiHondurasHong KongHungaryIndiaIndonesiaIranIraqIrelandIsraelItalyJamaicaJapanJordanKazakhstanKenyaKoreaKuwaitLaosLatin AmericaLatviaLebanonLiberiaLithuaniaMalaysiaMexicoMicronesiaMiddle AfricaMoldovaMoroccoNepalNetherlandsNicaraguaNigeriaNorth AmericaNorth MacedoniaNorthern AfricaNorthern EuropeNorwayOceaniaPakistanPanamaPeruPhilippinesPolandPortugalRomaniaRussiaSaudi ArabiaScotlandSenegalSerbiaSierra LeoneSingaporeSomaliaSouth AfricaSouth AmericaSouth Central AsiaSouth Eastern AsiaSouthern EuropeSpainSri LankaSt. Vincent and the GrenadinesSudanSwedenSwitzerlandSyriaTaiwanThailandTrinidad and TobagoTurkeyUgandaUkraineUruguayUzbekistanVenezuelaVietnamWest IndiesWestern AfricaWestern AsiaWestern EuropeYemenZaireZimbabweAzores
Select to Compare
Race
Ancestry
AfghanAfricanAlaskan AthabascanAlbanianAleutAlsatianAmericanApacheArabArapahoArgentineanArmenianAssyrian/Chaldean/SyriacAustralianAustrianBahamianBangladeshiBarbadianBasqueBelgianBelizeanBermudanBhutaneseBlackfeetBolivianBrazilianBritishBritish West IndianBulgarianBurmeseCajunCambodianCanadianCape VerdeanCarpatho RusynCelticCentral AmericanCentral American IndianCherokeeCheyenneChickasawChileanChineseChippewaChoctawColombianColvilleComancheCosta RicanCreeCreekCroatianCrowCubanCypriotCzechCzechoslovakianDanishDelawareDominicanDutchDutch West IndianEastern EuropeanEcuadorianEgyptianEnglishEstonianEthiopianEuropeanFijianFilipinoFinnishFrenchFrench American IndianFrench CanadianGermanGerman RussianGhanaianGreekGuamanian/ChamorroGuatemalanGuyaneseHaitianHmongHonduranHopiHoumaHungarianIcelanderIndian (Asian)IndonesianInupiatIranianIraqiIrishIroquoisIsraeliItalianJamaicanJapaneseJordanianKenyanKiowaKoreanLaotianLatvianLebaneseLiberianLithuanianLumbeeLuxembourgerMacedonianMalaysianMalteseMarshalleseMenomineeMexicanMexican American IndianMongolianMoroccanNative HawaiianNavajoNepaleseNew ZealanderNicaraguanNigerianNorthern EuropeanNorwegianOkinawanOsageOttawaPaiutePakistaniPalestinianPanamanianParaguayanPennsylvania GermanPeruvianPimaPolishPortuguesePotawatomiPuebloPuerto RicanPuget Sound SalishRomanianRussianSalvadoranSamoanScandinavianScotch-IrishScottishSeminoleSenegaleseSerbianShoshoneSierra LeoneanSiouxSlavicSlovakSloveneSomaliSouth AfricanSouth AmericanSouth American IndianSoviet UnionSpaniardSpanishSpanish AmericanSpanish American IndianSri LankanSubsaharan AfricanSudaneseSwedishSwissSyrianTaiwaneseThaiTlingit-HaidaTohono O'OdhamTonganTrinidadian and TobagonianTsimshianTurkishU.S. Virgin IslanderUgandanUkrainianUruguayanUteVenezuelanVietnameseWelshWest IndianYakamaYaquiYugoslavianYumanYup'ikZimbabwean
Immigration
NonimmigrantsImmigrantsAfghanistanAfricaAlbaniaArgentinaArmeniaAsiaAustraliaAustriaBahamasBangladeshBarbadosBelarusBelgiumBelizeBoliviaBosnia and HerzegovinaBrazilBulgariaBurma/MyanmarCabo VerdeCambodiaCameroonCanadaCaribbeanCentral AmericaChileChinaColombiaCongoCosta RicaCroatiaCubaCzechoslovakiaDenmarkDominicaDominican RepublicEastern AfricaEastern AsiaEastern EuropeEcuadorEgyptEl SalvadorEnglandEritreaEthiopiaEuropeFijiFranceGermanyGhanaGreeceGrenadaGuatemalaGuyanaHaitiHondurasHong KongHungaryIndiaIndonesiaIranIraqIrelandIsraelItalyJamaicaJapanJordanKazakhstanKenyaKoreaKuwaitLaosLatin AmericaLatviaLebanonLiberiaLithuaniaMalaysiaMexicoMicronesiaMiddle AfricaMoldovaMoroccoNepalNetherlandsNicaraguaNigeriaNorth AmericaNorth MacedoniaNorthern AfricaNorthern EuropeNorwayOceaniaPakistanPanamaPeruPhilippinesPolandPortugalRomaniaRussiaSaudi ArabiaScotlandSenegalSerbiaSierra LeoneSingaporeSomaliaSouth AfricaSouth AmericaSouth Central AsiaSouth Eastern AsiaSouthern EuropeSpainSri LankaSt. Vincent and the GrenadinesSudanSwedenSwitzerlandSyriaTaiwanThailandTrinidad and TobagoTurkeyUgandaUkraineUruguayUzbekistanVenezuelaVietnamWest IndiesWestern AfricaWestern AsiaWestern EuropeYemenZaireZimbabweAzores
Married-Couple Family Poverty
Income
Poverty
Unemployment
Labor Participation
Family Structure
Vehicle Availability
Education Level
Disability

Alaska Native Married-Couple Family Poverty
Tragic

6.2%
POVERTY | MARRIED-COUPLE FAMILIES
0.2/ 100
METRIC RATING
268th/ 347
METRIC RANK

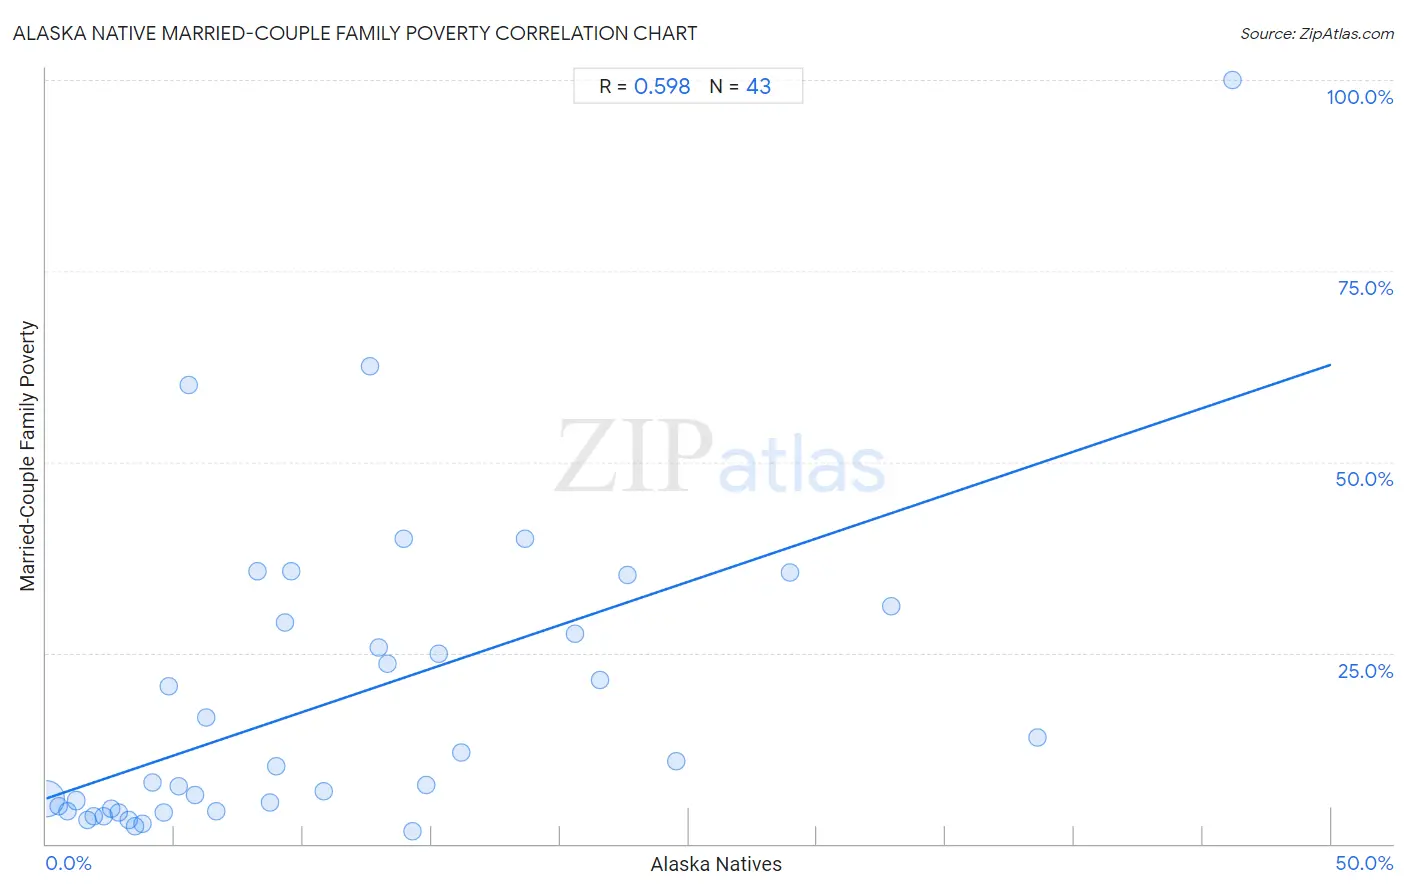
Alaska Native Married-Couple Family Poverty Correlation Chart

The statistical analysis conducted on geographies consisting of 76,597,225 people shows a substantial positive correlation between the proportion of Alaska Natives and poverty level among married-couple families in the United States with a correlation coefficient (R) of 0.598 and weighted average of 6.2%. On average, for every 1% (one percent) increase in Alaska Natives within a typical geography, there is an increase of 1.1% in poverty level among married-couple families.
Alaska Native Married-Couple Family Poverty
It is essential to understand that the correlation between the percentage of Alaska Natives and poverty level among married-couple families does not imply a direct cause-and-effect relationship. It remains uncertain whether the presence of Alaska Natives influences an upward or downward trend in the level of poverty level among married-couple families within an area, or if Alaska Natives simply ended up residing in those areas with higher or lower levels of poverty level among married-couple families due to other factors.

Demographics Similar to Alaska Natives by Married-Couple Family Poverty

In terms of married-couple family poverty, the demographic groups most similar to Alaska Natives are Immigrants from West Indies (6.2%, a difference of 0.17%), Immigrants from Jamaica (6.2%, a difference of 0.21%), Immigrants from Bahamas (6.2%, a difference of 0.43%), Trinidadian and Tobagonian (6.2%, a difference of 0.46%), and Spanish American (6.2%, a difference of 0.48%).
DemographicsRating | RankMarried-Couple Family Poverty
Senegalese
0.3
/100
|
#261
Tragic
6.1%
Shoshone
0.3
/100
|
#262
Tragic
6.1%
Immigrants from Senegal
0.3
/100
|
#263
Tragic
6.1%
Immigrants from Congo
0.2
/100
|
#264
Tragic
6.1%
Blackfeet
0.2
/100
|
#265
Tragic
6.2%
Creek
0.2
/100
|
#266
Tragic
6.2%
Spanish Americans
0.2
/100
|
#267
Tragic
6.2%
Alaska Natives
0.2
/100
|
#268
Tragic
6.2%
Immigrants from West Indies
0.1
/100
|
#269
Tragic
6.2%
Immigrants from Jamaica
0.1
/100
|
#270
Tragic
6.2%
Immigrants from Bahamas
0.1
/100
|
#271
Tragic
6.2%
Trinidadians and Tobagonians
0.1
/100
|
#272
Tragic
6.2%
Colville
0.1
/100
|
#273
Tragic
6.3%
Barbadians
0.1
/100
|
#274
Tragic
6.3%
Choctaw
0.1
/100
|
#275
Tragic
6.3%

Alaska Native Married-Couple Family Poverty Correlation Summary

MeasurementAlaska Native DataMarried-Couple Family Poverty Data
Minimum0.020%1.6%
Maximum46.2%100.0%
Range46.1%98.4%
Mean11.4%18.9%
Median8.7%10.2%
Interquartile 25% (IQ1)3.5%4.3%
Interquartile 75% (IQ3)15.3%28.9%
Interquartile Range (IQR)11.8%24.6%
Standard Deviation (Sample)10.6%20.2%
Standard Deviation (Population)10.5%19.9%

Correlation Details

Alaska Native PercentileSample SizeMarried-Couple Family Poverty
[
0.0%
-
0.5%
]
0.020%
74,677,0275.9%
[
0.0%
-
0.5%
]
0.47%
543,6244.9%
[
0.5%
-
1.0%
]
0.81%
95,3184.3%
[
1.0%
-
1.5%
]
1.17%
136,0055.6%
[
1.5%
-
2.0%
]
1.61%
438,4803.2%
[
1.5%
-
2.0%
]
1.85%
109,7703.6%
[
2.0%
-
2.5%
]
2.24%
125,1933.6%
[
2.5%
-
3.0%
]
2.55%
93,5564.6%
[
2.5%
-
3.0%
]
2.81%
105,0204.2%
[
3.0%
-
3.5%
]
3.22%
57,1093.2%
[
3.0%
-
3.5%
]
3.47%
103,9042.2%
[
3.5%
-
4.0%
]
3.77%
21,9372.6%
[
4.0%
-
4.5%
]
4.14%
35,2708.0%
[
4.5%
-
5.0%
]
4.56%
10,9324.0%
[
4.5%
-
5.0%
]
4.78%
1,33920.6%
[
5.0%
-
5.5%
]
5.15%
6,6957.5%
[
5.5%
-
6.0%
]
5.53%
39860.0%
[
5.5%
-
6.0%
]
5.78%
3296.4%
[
6.0%
-
6.5%
]
6.23%
1,20416.5%
[
6.5%
-
7.0%
]
6.60%
3794.2%
[
8.0%
-
8.5%
]
8.20%
25635.7%
[
8.5%
-
9.0%
]
8.69%
1,1285.4%
[
8.5%
-
9.0%
]
8.96%
2,90210.2%
[
9.0%
-
9.5%
]
9.29%
56028.9%
[
9.5%
-
10.0%
]
9.55%
22035.7%
[
10.5%
-
11.0%
]
10.79%
1,6686.9%
[
12.5%
-
13.0%
]
12.61%
44462.5%
[
12.5%
-
13.0%
]
12.95%
2,07725.7%
[
13.0%
-
13.5%
]
13.26%
55823.5%
[
13.5%
-
14.0%
]
13.89%
86440.0%
[
14.0%
-
14.5%
]
14.23%
8431.6%
[
14.5%
-
15.0%
]
14.78%
9,7557.7%
[
15.0%
-
15.5%
]
15.25%
2,71424.8%
[
16.0%
-
16.5%
]
16.13%
15512.0%
[
18.5%
-
19.0%
]
18.64%
23640.0%
[
20.5%
-
21.0%
]
20.60%
2,55427.5%
[
21.5%
-
22.0%
]
21.55%
1,82821.4%
[
22.5%
-
23.0%
]
22.63%
76035.1%
[
24.0%
-
24.5%
]
24.49%
69010.8%
[
28.5%
-
29.0%
]
28.92%
83035.5%
[
32.5%
-
33.0%
]
32.89%
90031.0%
[
38.5%
-
39.0%
]
38.57%
1,76813.8%
[
46.0%
-
46.5%
]
46.15%
26100.0%