Alaska Native College, Under 1 year
COMPARE
Alaska Native
Select to Compare
College, Under 1 year
Alaska Native College, Under 1 year
60.4%
COLLEGE, UNDER 1 YEAR
0.1/ 100
METRIC RATING
274th/ 347
METRIC RANK
Alaska Native College, Under 1 year Correlation Chart
The statistical analysis conducted on geographies consisting of 76,778,531 people shows a substantial negative correlation between the proportion of Alaska Natives and percentage of population with at least college, under 1 year education in the United States with a correlation coefficient (R) of -0.526 and weighted average of 60.4%. On average, for every 1% (one percent) increase in Alaska Natives within a typical geography, there is a decrease of 0.64% in percentage of population with at least college, under 1 year education.
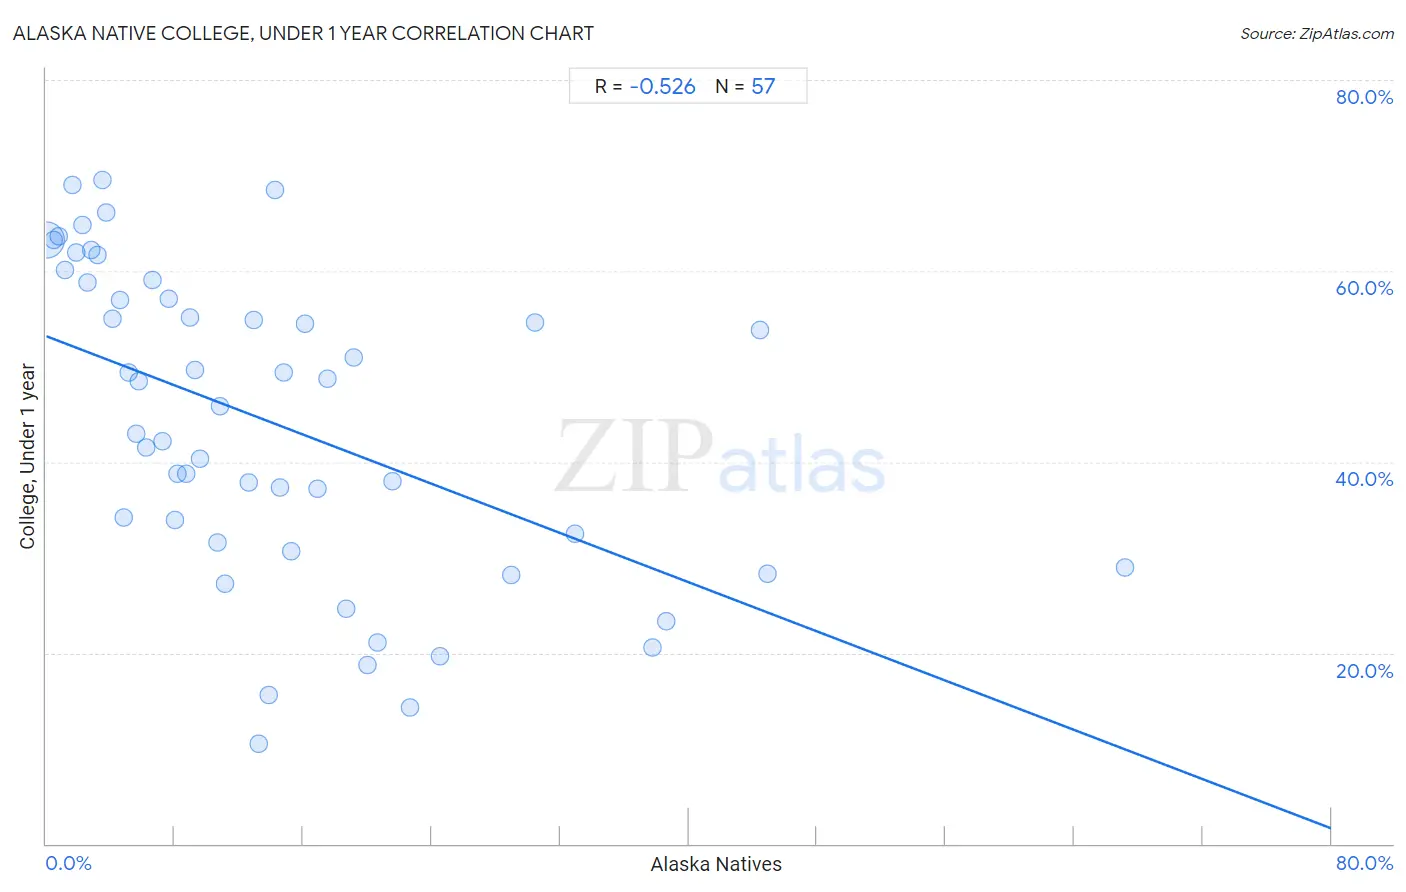
It is essential to understand that the correlation between the percentage of Alaska Natives and percentage of population with at least college, under 1 year education does not imply a direct cause-and-effect relationship. It remains uncertain whether the presence of Alaska Natives influences an upward or downward trend in the level of percentage of population with at least college, under 1 year education within an area, or if Alaska Natives simply ended up residing in those areas with higher or lower levels of percentage of population with at least college, under 1 year education due to other factors.
Demographics Similar to Alaska Natives by College, Under 1 year
In terms of college, under 1 year, the demographic groups most similar to Alaska Natives are Chickasaw (60.4%, a difference of 0.0%), Jamaican (60.5%, a difference of 0.050%), Immigrants from Barbados (60.4%, a difference of 0.13%), Arapaho (60.3%, a difference of 0.16%), and U.S. Virgin Islander (60.6%, a difference of 0.20%).
| Demographics | Rating | Rank | College, Under 1 year |
| Americans | 0.2 /100 | #267 | Tragic 61.0% |
| Immigrants from Trinidad and Tobago | 0.1 /100 | #268 | Tragic 60.7% |
| Immigrants from West Indies | 0.1 /100 | #269 | Tragic 60.6% |
| Cheyenne | 0.1 /100 | #270 | Tragic 60.6% |
| U.S. Virgin Islanders | 0.1 /100 | #271 | Tragic 60.6% |
| Jamaicans | 0.1 /100 | #272 | Tragic 60.5% |
| Chickasaw | 0.1 /100 | #273 | Tragic 60.4% |
| Alaska Natives | 0.1 /100 | #274 | Tragic 60.4% |
| Immigrants from Barbados | 0.1 /100 | #275 | Tragic 60.4% |
| Arapaho | 0.1 /100 | #276 | Tragic 60.3% |
| Bahamians | 0.1 /100 | #277 | Tragic 60.3% |
| Yaqui | 0.1 /100 | #278 | Tragic 60.2% |
| Ute | 0.1 /100 | #279 | Tragic 60.2% |
| Crow | 0.1 /100 | #280 | Tragic 60.2% |
| Cherokee | 0.1 /100 | #281 | Tragic 60.1% |
Alaska Native College, Under 1 year Correlation Summary
| Measurement | Alaska Native Data | College, Under 1 year Data |
| Minimum | 0.020% | 10.5% |
| Maximum | 67.1% | 69.5% |
| Range | 67.1% | 59.0% |
| Mean | 14.1% | 44.1% |
| Median | 10.7% | 45.8% |
| Interquartile 25% (IQ1) | 4.7% | 31.1% |
| Interquartile 75% (IQ3) | 18.9% | 58.0% |
| Interquartile Range (IQR) | 14.2% | 26.9% |
| Standard Deviation (Sample) | 13.2% | 16.2% |
| Standard Deviation (Population) | 13.1% | 16.0% |
Correlation Details
| Alaska Native Percentile | Sample Size | College, Under 1 year |
[ 0.0% - 0.5% ] 0.020% | 74,745,615 | 63.2% |
[ 0.0% - 0.5% ] 0.47% | 574,439 | 63.2% |
[ 0.5% - 1.0% ] 0.81% | 109,403 | 63.6% |
[ 1.0% - 1.5% ] 1.17% | 160,954 | 60.1% |
[ 1.5% - 2.0% ] 1.61% | 442,592 | 69.0% |
[ 1.5% - 2.0% ] 1.85% | 110,172 | 62.0% |
[ 2.0% - 2.5% ] 2.24% | 135,927 | 64.8% |
[ 2.5% - 3.0% ] 2.55% | 95,573 | 58.9% |
[ 2.5% - 3.0% ] 2.81% | 106,439 | 62.1% |
[ 3.0% - 3.5% ] 3.22% | 58,493 | 61.7% |
[ 3.0% - 3.5% ] 3.48% | 111,167 | 69.5% |
[ 3.5% - 4.0% ] 3.77% | 26,605 | 66.1% |
[ 4.0% - 4.5% ] 4.14% | 35,270 | 55.0% |
[ 4.5% - 5.0% ] 4.56% | 11,330 | 56.9% |
[ 4.5% - 5.0% ] 4.79% | 1,419 | 34.1% |
[ 5.0% - 5.5% ] 5.15% | 8,636 | 49.4% |
[ 5.5% - 6.0% ] 5.59% | 2,308 | 42.9% |
[ 5.5% - 6.0% ] 5.78% | 329 | 48.5% |
[ 6.0% - 6.5% ] 6.19% | 1,712 | 41.5% |
[ 6.5% - 7.0% ] 6.58% | 471 | 59.0% |
[ 7.0% - 7.5% ] 7.22% | 2,893 | 42.2% |
[ 7.5% - 8.0% ] 7.60% | 803 | 57.1% |
[ 8.0% - 8.5% ] 8.05% | 174 | 33.9% |
[ 8.0% - 8.5% ] 8.20% | 256 | 38.8% |
[ 8.5% - 9.0% ] 8.69% | 1,128 | 38.8% |
[ 8.5% - 9.0% ] 8.96% | 2,969 | 55.2% |
[ 9.0% - 9.5% ] 9.29% | 452 | 49.7% |
[ 9.5% - 10.0% ] 9.55% | 220 | 40.3% |
[ 10.5% - 11.0% ] 10.66% | 544 | 31.6% |
[ 10.5% - 11.0% ] 10.79% | 1,668 | 45.8% |
[ 11.0% - 11.5% ] 11.11% | 144 | 27.3% |
[ 12.5% - 13.0% ] 12.61% | 444 | 37.8% |
[ 12.5% - 13.0% ] 12.95% | 2,077 | 54.8% |
[ 13.0% - 13.5% ] 13.26% | 558 | 10.5% |
[ 13.5% - 14.0% ] 13.89% | 864 | 15.6% |
[ 14.0% - 14.5% ] 14.23% | 843 | 68.5% |
[ 14.5% - 15.0% ] 14.52% | 248 | 37.4% |
[ 14.5% - 15.0% ] 14.78% | 9,863 | 49.3% |
[ 15.0% - 15.5% ] 15.25% | 2,714 | 30.6% |
[ 16.0% - 16.5% ] 16.13% | 155 | 54.5% |
[ 16.5% - 17.0% ] 16.91% | 272 | 37.1% |
[ 17.0% - 17.5% ] 17.50% | 40 | 48.6% |
[ 18.5% - 19.0% ] 18.64% | 236 | 24.7% |
[ 19.0% - 19.5% ] 19.12% | 68 | 50.9% |
[ 20.0% - 20.5% ] 20.00% | 60 | 18.8% |
[ 20.5% - 21.0% ] 20.60% | 2,554 | 21.0% |
[ 21.5% - 22.0% ] 21.55% | 1,828 | 38.0% |
[ 22.5% - 23.0% ] 22.63% | 760 | 14.3% |
[ 24.0% - 24.5% ] 24.49% | 690 | 19.7% |
[ 28.5% - 29.0% ] 28.92% | 830 | 28.2% |
[ 30.0% - 30.5% ] 30.43% | 46 | 54.5% |
[ 32.5% - 33.0% ] 32.89% | 900 | 32.5% |
[ 37.5% - 38.0% ] 37.76% | 98 | 20.5% |
[ 38.5% - 39.0% ] 38.57% | 1,768 | 23.3% |
[ 44.0% - 44.5% ] 44.44% | 54 | 53.8% |
[ 44.5% - 45.0% ] 44.94% | 316 | 28.3% |
[ 67.0% - 67.5% ] 67.14% | 140 | 28.9% |