Alaska Native Married-couple Households
COMPARE
Alaska Native
Select to Compare
Married-couple Households
Alaska Native Married-couple Households
45.6%
MARRIED-COUPLE HOUSEHOLDS
13.0/ 100
METRIC RATING
203rd/ 347
METRIC RANK
Alaska Native Married-couple Households Correlation Chart
The statistical analysis conducted on geographies consisting of 76,754,509 people shows a weak positive correlation between the proportion of Alaska Natives and percentage of married-couple family households in the United States with a correlation coefficient (R) of 0.238 and weighted average of 45.6%. On average, for every 1% (one percent) increase in Alaska Natives within a typical geography, there is an increase of 0.24% in percentage of married-couple family households.
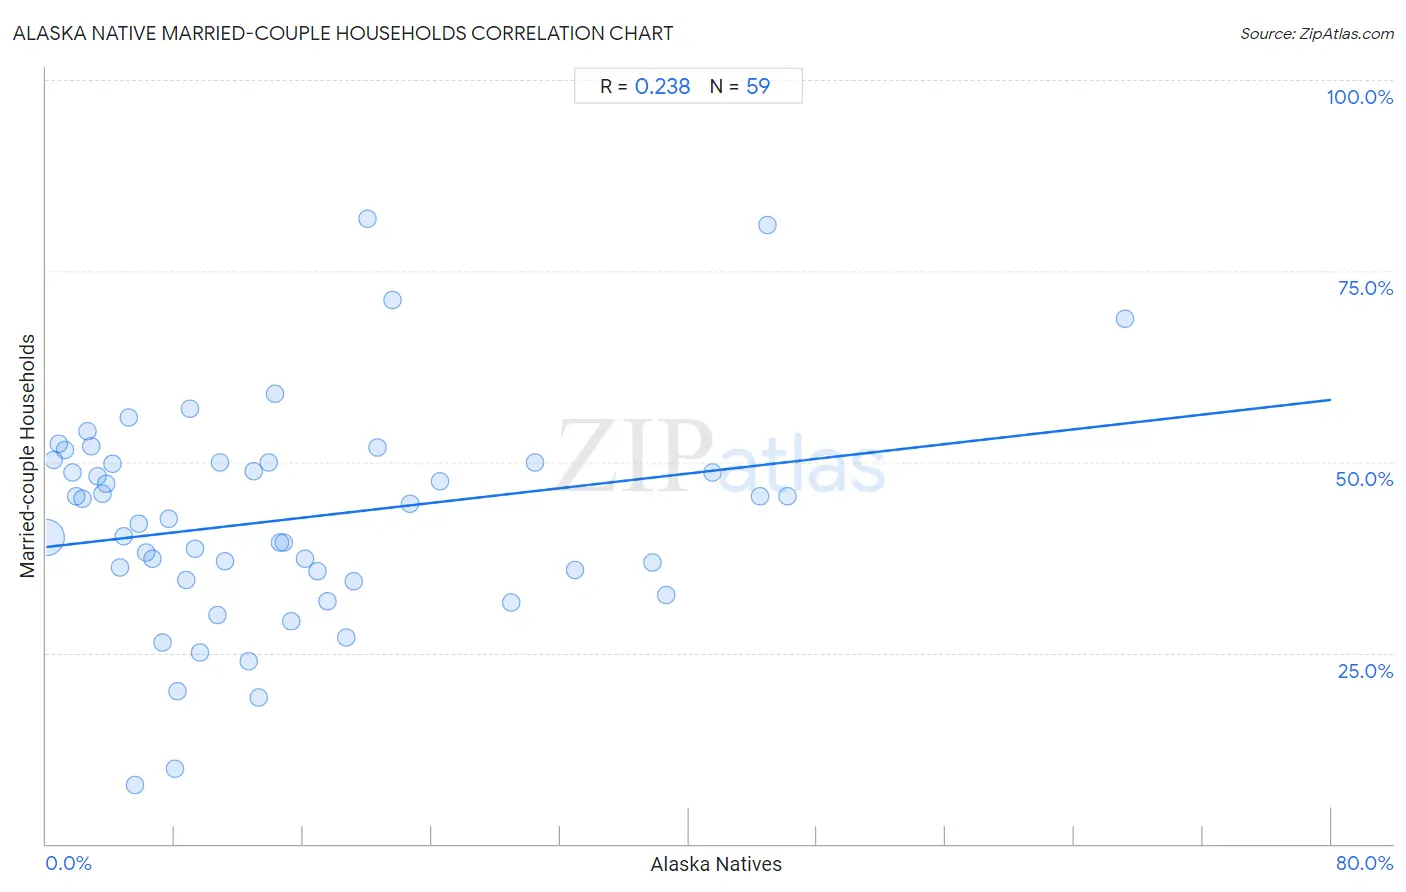
It is essential to understand that the correlation between the percentage of Alaska Natives and percentage of married-couple family households does not imply a direct cause-and-effect relationship. It remains uncertain whether the presence of Alaska Natives influences an upward or downward trend in the level of percentage of married-couple family households within an area, or if Alaska Natives simply ended up residing in those areas with higher or lower levels of percentage of married-couple family households due to other factors.
Demographics Similar to Alaska Natives by Married-couple Households
In terms of married-couple households, the demographic groups most similar to Alaska Natives are Aleut (45.6%, a difference of 0.050%), Immigrants from Central America (45.7%, a difference of 0.090%), Nepalese (45.6%, a difference of 0.10%), Immigrants from Serbia (45.7%, a difference of 0.17%), and Potawatomi (45.7%, a difference of 0.20%).
| Demographics | Rating | Rank | Married-couple Households |
| Immigrants from South America | 22.2 /100 | #196 | Fair 45.9% |
| Cambodians | 21.3 /100 | #197 | Fair 45.9% |
| Ottawa | 19.4 /100 | #198 | Poor 45.8% |
| Carpatho Rusyns | 15.7 /100 | #199 | Poor 45.7% |
| Potawatomi | 15.6 /100 | #200 | Poor 45.7% |
| Immigrants from Serbia | 15.2 /100 | #201 | Poor 45.7% |
| Immigrants from Central America | 14.2 /100 | #202 | Poor 45.7% |
| Alaska Natives | 13.0 /100 | #203 | Poor 45.6% |
| Aleuts | 12.5 /100 | #204 | Poor 45.6% |
| Nepalese | 11.9 /100 | #205 | Poor 45.6% |
| Uruguayans | 10.4 /100 | #206 | Poor 45.5% |
| Immigrants from France | 8.8 /100 | #207 | Tragic 45.4% |
| Hispanics or Latinos | 8.7 /100 | #208 | Tragic 45.4% |
| Immigrants from Uzbekistan | 8.4 /100 | #209 | Tragic 45.4% |
| Cubans | 7.7 /100 | #210 | Tragic 45.4% |
Alaska Native Married-couple Households Correlation Summary
| Measurement | Alaska Native Data | Married-couple Households Data |
| Minimum | 0.020% | 7.7% |
| Maximum | 67.1% | 81.8% |
| Range | 67.1% | 74.1% |
| Mean | 15.1% | 42.5% |
| Median | 10.8% | 42.6% |
| Interquartile 25% (IQ1) | 4.8% | 34.6% |
| Interquartile 75% (IQ3) | 20.0% | 50.0% |
| Interquartile Range (IQR) | 15.2% | 15.4% |
| Standard Deviation (Sample) | 14.1% | 14.3% |
| Standard Deviation (Population) | 13.9% | 14.1% |
Correlation Details
| Alaska Native Percentile | Sample Size | Married-couple Households |
[ 0.0% - 0.5% ] 0.020% | 74,731,465 | 40.2% |
[ 0.0% - 0.5% ] 0.47% | 571,500 | 50.2% |
[ 0.5% - 1.0% ] 0.81% | 106,074 | 52.3% |
[ 1.0% - 1.5% ] 1.17% | 160,954 | 51.5% |
[ 1.5% - 2.0% ] 1.61% | 442,307 | 48.7% |
[ 1.5% - 2.0% ] 1.85% | 110,172 | 45.5% |
[ 2.0% - 2.5% ] 2.24% | 135,927 | 45.2% |
[ 2.5% - 3.0% ] 2.55% | 93,808 | 53.9% |
[ 2.5% - 3.0% ] 2.81% | 106,439 | 52.1% |
[ 3.0% - 3.5% ] 3.22% | 58,493 | 48.1% |
[ 3.0% - 3.5% ] 3.48% | 111,167 | 45.8% |
[ 3.5% - 4.0% ] 3.77% | 26,605 | 47.2% |
[ 4.0% - 4.5% ] 4.14% | 35,270 | 49.8% |
[ 4.5% - 5.0% ] 4.56% | 11,330 | 36.2% |
[ 4.5% - 5.0% ] 4.79% | 1,419 | 40.3% |
[ 5.0% - 5.5% ] 5.15% | 8,636 | 55.9% |
[ 5.5% - 6.0% ] 5.53% | 398 | 7.7% |
[ 5.5% - 6.0% ] 5.78% | 329 | 42.0% |
[ 6.0% - 6.5% ] 6.19% | 1,712 | 38.1% |
[ 6.5% - 7.0% ] 6.58% | 471 | 37.3% |
[ 7.0% - 7.5% ] 7.22% | 2,893 | 26.3% |
[ 7.5% - 8.0% ] 7.60% | 803 | 42.6% |
[ 8.0% - 8.5% ] 8.05% | 174 | 9.8% |
[ 8.0% - 8.5% ] 8.20% | 256 | 20.0% |
[ 8.5% - 9.0% ] 8.69% | 1,128 | 34.6% |
[ 8.5% - 9.0% ] 8.96% | 2,969 | 56.9% |
[ 9.0% - 9.5% ] 9.29% | 560 | 38.7% |
[ 9.5% - 10.0% ] 9.55% | 220 | 25.0% |
[ 10.5% - 11.0% ] 10.66% | 544 | 29.9% |
[ 10.5% - 11.0% ] 10.79% | 1,668 | 49.9% |
[ 11.0% - 11.5% ] 11.11% | 144 | 37.0% |
[ 12.5% - 13.0% ] 12.61% | 444 | 23.9% |
[ 12.5% - 13.0% ] 12.95% | 2,077 | 48.7% |
[ 13.0% - 13.5% ] 13.26% | 558 | 19.1% |
[ 13.5% - 14.0% ] 13.89% | 864 | 50.0% |
[ 14.0% - 14.5% ] 14.23% | 843 | 58.8% |
[ 14.5% - 15.0% ] 14.52% | 248 | 39.4% |
[ 14.5% - 15.0% ] 14.78% | 9,863 | 39.4% |
[ 15.0% - 15.5% ] 15.25% | 2,714 | 29.2% |
[ 16.0% - 16.5% ] 16.13% | 155 | 37.3% |
[ 16.5% - 17.0% ] 16.91% | 272 | 35.7% |
[ 17.0% - 17.5% ] 17.50% | 40 | 31.8% |
[ 18.5% - 19.0% ] 18.64% | 236 | 27.0% |
[ 19.0% - 19.5% ] 19.12% | 68 | 34.4% |
[ 20.0% - 20.5% ] 20.00% | 60 | 81.8% |
[ 20.5% - 21.0% ] 20.60% | 2,554 | 51.9% |
[ 21.5% - 22.0% ] 21.55% | 1,828 | 71.2% |
[ 22.5% - 23.0% ] 22.63% | 760 | 44.6% |
[ 24.0% - 24.5% ] 24.49% | 690 | 47.5% |
[ 28.5% - 29.0% ] 28.92% | 830 | 31.6% |
[ 30.0% - 30.5% ] 30.43% | 46 | 50.0% |
[ 32.5% - 33.0% ] 32.89% | 900 | 35.8% |
[ 37.5% - 38.0% ] 37.76% | 98 | 36.8% |
[ 38.5% - 39.0% ] 38.57% | 1,768 | 32.5% |
[ 41.0% - 41.5% ] 41.44% | 222 | 48.6% |
[ 44.0% - 44.5% ] 44.44% | 54 | 45.5% |
[ 44.5% - 45.0% ] 44.94% | 316 | 81.0% |
[ 46.0% - 46.5% ] 46.15% | 26 | 45.5% |
[ 67.0% - 67.5% ] 67.14% | 140 | 68.8% |