Zimbabwean 4 or more Vehicles in Household
COMPARE
Zimbabwean
Select to Compare
4 or more Vehicles in Household
Zimbabwean 4 or more Vehicles in Household
6.4%
4+ VEHICLES AVAILABLE
67.1/ 100
METRIC RATING
158th/ 347
METRIC RANK
Zimbabwean 4 or more Vehicles in Household Correlation Chart
The statistical analysis conducted on geographies consisting of 69,013,822 people shows a moderate positive correlation between the proportion of Zimbabweans and percentage of households with 4 or more vehicles available in the United States with a correlation coefficient (R) of 0.432 and weighted average of 6.4%. On average, for every 1% (one percent) increase in Zimbabweans within a typical geography, there is an increase of 2.4% in percentage of households with 4 or more vehicles available.
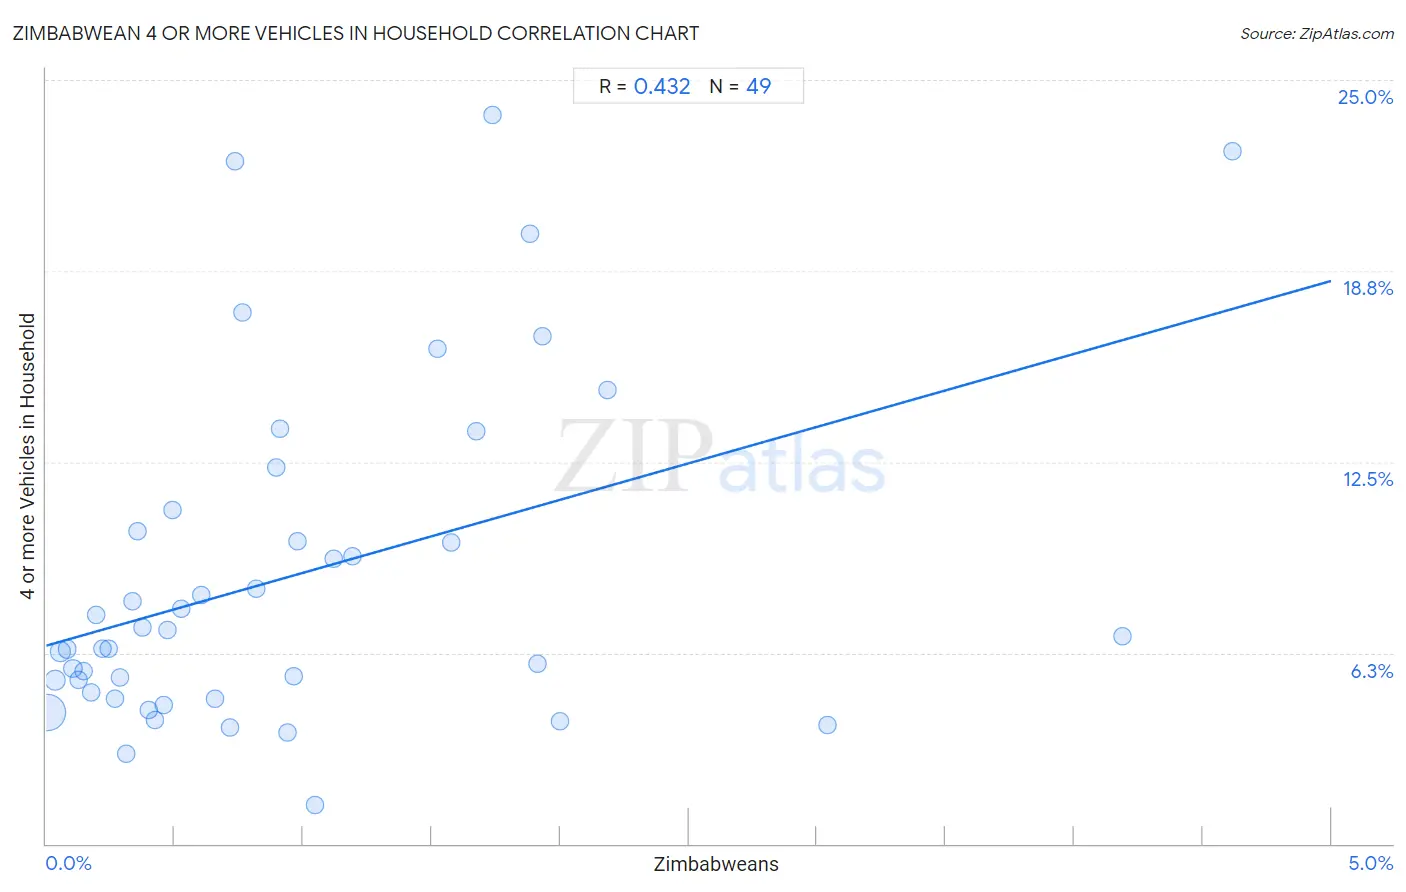
It is essential to understand that the correlation between the percentage of Zimbabweans and percentage of households with 4 or more vehicles available does not imply a direct cause-and-effect relationship. It remains uncertain whether the presence of Zimbabweans influences an upward or downward trend in the level of percentage of households with 4 or more vehicles available within an area, or if Zimbabweans simply ended up residing in those areas with higher or lower levels of percentage of households with 4 or more vehicles available due to other factors.
Demographics Similar to Zimbabweans by 4 or more Vehicles in Household
In terms of 4 or more vehicles in household, the demographic groups most similar to Zimbabweans are Indian (Asian) (6.4%, a difference of 0.090%), Palestinian (6.4%, a difference of 0.15%), Peruvian (6.5%, a difference of 0.27%), Immigrants from Cameroon (6.4%, a difference of 0.30%), and Iranian (6.5%, a difference of 0.32%).
| Demographics | Rating | Rank | 4 or more Vehicles in Household |
| Immigrants from Hong Kong | 72.2 /100 | #151 | Good 6.5% |
| Yuman | 72.1 /100 | #152 | Good 6.5% |
| Immigrants from Armenia | 71.2 /100 | #153 | Good 6.5% |
| Central American Indians | 71.1 /100 | #154 | Good 6.5% |
| Iroquois | 70.4 /100 | #155 | Good 6.5% |
| Iranians | 69.9 /100 | #156 | Good 6.5% |
| Peruvians | 69.4 /100 | #157 | Good 6.5% |
| Zimbabweans | 67.1 /100 | #158 | Good 6.4% |
| Indians (Asian) | 66.3 /100 | #159 | Good 6.4% |
| Palestinians | 65.8 /100 | #160 | Good 6.4% |
| Immigrants from Cameroon | 64.4 /100 | #161 | Good 6.4% |
| Immigrants from Pakistan | 63.2 /100 | #162 | Good 6.4% |
| Chileans | 61.2 /100 | #163 | Good 6.4% |
| Hungarians | 61.1 /100 | #164 | Good 6.4% |
| Immigrants from Peru | 59.8 /100 | #165 | Average 6.4% |
Zimbabwean 4 or more Vehicles in Household Correlation Summary
| Measurement | Zimbabwean Data | 4 or more Vehicles in Household Data |
| Minimum | 0.0070% | 1.3% |
| Maximum | 4.6% | 23.8% |
| Range | 4.6% | 22.6% |
| Mean | 0.95% | 8.8% |
| Median | 0.65% | 6.8% |
| Interquartile 25% (IQ1) | 0.28% | 4.9% |
| Interquartile 75% (IQ3) | 1.4% | 10.6% |
| Interquartile Range (IQR) | 1.1% | 5.7% |
| Standard Deviation (Sample) | 0.99% | 5.5% |
| Standard Deviation (Population) | 0.98% | 5.4% |
Correlation Details
| Zimbabwean Percentile | Sample Size | 4 or more Vehicles in Household |
[ 0.0% - 0.5% ] 0.0070% | 51,295,324 | 4.3% |
[ 0.0% - 0.5% ] 0.033% | 5,767,923 | 5.3% |
[ 0.0% - 0.5% ] 0.055% | 4,716,596 | 6.3% |
[ 0.0% - 0.5% ] 0.081% | 1,658,266 | 6.4% |
[ 0.0% - 0.5% ] 0.10% | 1,247,083 | 5.7% |
[ 0.0% - 0.5% ] 0.13% | 780,355 | 5.4% |
[ 0.0% - 0.5% ] 0.15% | 727,115 | 5.7% |
[ 0.0% - 0.5% ] 0.17% | 474,856 | 5.0% |
[ 0.0% - 0.5% ] 0.19% | 524,820 | 7.5% |
[ 0.0% - 0.5% ] 0.22% | 314,460 | 6.4% |
[ 0.0% - 0.5% ] 0.24% | 305,507 | 6.4% |
[ 0.0% - 0.5% ] 0.27% | 189,313 | 4.8% |
[ 0.0% - 0.5% ] 0.29% | 211,694 | 5.4% |
[ 0.0% - 0.5% ] 0.31% | 73,525 | 2.9% |
[ 0.0% - 0.5% ] 0.33% | 38,979 | 7.9% |
[ 0.0% - 0.5% ] 0.35% | 5,659 | 10.2% |
[ 0.0% - 0.5% ] 0.38% | 51,368 | 7.1% |
[ 0.0% - 0.5% ] 0.40% | 28,458 | 4.4% |
[ 0.0% - 0.5% ] 0.43% | 23,993 | 4.1% |
[ 0.0% - 0.5% ] 0.46% | 24,646 | 4.5% |
[ 0.0% - 0.5% ] 0.47% | 145,012 | 7.0% |
[ 0.0% - 0.5% ] 0.49% | 31,794 | 10.9% |
[ 0.5% - 1.0% ] 0.53% | 4,748 | 7.7% |
[ 0.5% - 1.0% ] 0.60% | 15,207 | 8.1% |
[ 0.5% - 1.0% ] 0.65% | 43,706 | 4.8% |
[ 0.5% - 1.0% ] 0.72% | 10,209 | 3.8% |
[ 0.5% - 1.0% ] 0.73% | 273 | 22.3% |
[ 0.5% - 1.0% ] 0.76% | 2,095 | 17.4% |
[ 0.5% - 1.0% ] 0.82% | 23,805 | 8.3% |
[ 0.5% - 1.0% ] 0.89% | 33,967 | 12.3% |
[ 0.5% - 1.0% ] 0.91% | 27,829 | 13.6% |
[ 0.5% - 1.0% ] 0.94% | 8,635 | 3.7% |
[ 0.5% - 1.0% ] 0.96% | 29,545 | 5.5% |
[ 0.5% - 1.0% ] 0.98% | 17,914 | 9.9% |
[ 1.0% - 1.5% ] 1.04% | 6,995 | 1.3% |
[ 1.0% - 1.5% ] 1.12% | 36,749 | 9.3% |
[ 1.0% - 1.5% ] 1.19% | 15,934 | 9.4% |
[ 1.5% - 2.0% ] 1.52% | 197 | 16.2% |
[ 1.5% - 2.0% ] 1.58% | 12,045 | 9.9% |
[ 1.5% - 2.0% ] 1.67% | 957 | 13.5% |
[ 1.5% - 2.0% ] 1.74% | 8,242 | 23.8% |
[ 1.5% - 2.0% ] 1.88% | 1,221 | 20.0% |
[ 1.5% - 2.0% ] 1.91% | 19,842 | 5.9% |
[ 1.5% - 2.0% ] 1.93% | 15,244 | 16.6% |
[ 2.0% - 2.5% ] 2.00% | 13,247 | 4.0% |
[ 2.0% - 2.5% ] 2.18% | 17,261 | 14.8% |
[ 3.0% - 3.5% ] 3.04% | 6,775 | 3.9% |
[ 4.0% - 4.5% ] 4.19% | 2,961 | 6.8% |
[ 4.5% - 5.0% ] 4.62% | 1,473 | 22.7% |