Zimbabwean 2 or more Vehicles in Household

COMPARE

Zimbabwean
Race
Ancestry
AfghanAfricanAlaska NativeAlaskan AthabascanAlbanianAleutAlsatianAmericanApacheArabArapahoArgentineanArmenianAssyrian/Chaldean/SyriacAustralianAustrianBahamianBangladeshiBarbadianBasqueBelgianBelizeanBermudanBhutaneseBlackfeetBolivianBrazilianBritishBritish West IndianBulgarianBurmeseCajunCambodianCanadianCape VerdeanCarpatho RusynCelticCentral AmericanCentral American IndianCherokeeCheyenneChickasawChileanChineseChippewaChoctawColombianColvilleComancheCosta RicanCreeCreekCroatianCrowCubanCypriotCzechCzechoslovakianDanishDelawareDominicanDutchDutch West IndianEastern EuropeanEcuadorianEgyptianEnglishEstonianEthiopianEuropeanFijianFilipinoFinnishFrenchFrench American IndianFrench CanadianGermanGerman RussianGhanaianGreekGuamanian/ChamorroGuatemalanGuyaneseHaitianHmongHonduranHopiHoumaHungarianIcelanderIndian (Asian)IndonesianInupiatIranianIraqiIrishIroquoisIsraeliItalianJamaicanJapaneseJordanianKenyanKiowaKoreanLaotianLatvianLebaneseLiberianLithuanianLumbeeLuxembourgerMacedonianMalaysianMalteseMarshalleseMenomineeMexicanMexican American IndianMongolianMoroccanNative HawaiianNavajoNepaleseNew ZealanderNicaraguanNigerianNorthern EuropeanNorwegianOkinawanOsageOttawaPaiutePakistaniPalestinianPanamanianParaguayanPennsylvania GermanPeruvianPimaPolishPortuguesePotawatomiPuebloPuerto RicanPuget Sound SalishRomanianRussianSalvadoranSamoanScandinavianScotch-IrishScottishSeminoleSenegaleseSerbianShoshoneSierra LeoneanSiouxSlavicSlovakSloveneSomaliSouth AfricanSouth AmericanSouth American IndianSoviet UnionSpaniardSpanishSpanish AmericanSpanish American IndianSri LankanSubsaharan AfricanSudaneseSwedishSwissSyrianTaiwaneseThaiTlingit-HaidaTohono O'OdhamTonganTrinidadian and TobagonianTsimshianTurkishU.S. Virgin IslanderUgandanUkrainianUruguayanUteVenezuelanVietnameseWelshWest IndianYakamaYaquiYugoslavianYumanYup'ikZimbabwean
Immigration
NonimmigrantsImmigrantsAfghanistanAfricaAlbaniaArgentinaArmeniaAsiaAustraliaAustriaBahamasBangladeshBarbadosBelarusBelgiumBelizeBoliviaBosnia and HerzegovinaBrazilBulgariaBurma/MyanmarCabo VerdeCambodiaCameroonCanadaCaribbeanCentral AmericaChileChinaColombiaCongoCosta RicaCroatiaCubaCzechoslovakiaDenmarkDominicaDominican RepublicEastern AfricaEastern AsiaEastern EuropeEcuadorEgyptEl SalvadorEnglandEritreaEthiopiaEuropeFijiFranceGermanyGhanaGreeceGrenadaGuatemalaGuyanaHaitiHondurasHong KongHungaryIndiaIndonesiaIranIraqIrelandIsraelItalyJamaicaJapanJordanKazakhstanKenyaKoreaKuwaitLaosLatin AmericaLatviaLebanonLiberiaLithuaniaMalaysiaMexicoMicronesiaMiddle AfricaMoldovaMoroccoNepalNetherlandsNicaraguaNigeriaNorth AmericaNorth MacedoniaNorthern AfricaNorthern EuropeNorwayOceaniaPakistanPanamaPeruPhilippinesPolandPortugalRomaniaRussiaSaudi ArabiaScotlandSenegalSerbiaSierra LeoneSingaporeSomaliaSouth AfricaSouth AmericaSouth Central AsiaSouth Eastern AsiaSouthern EuropeSpainSri LankaSt. Vincent and the GrenadinesSudanSwedenSwitzerlandSyriaTaiwanThailandTrinidad and TobagoTurkeyUgandaUkraineUruguayUzbekistanVenezuelaVietnamWest IndiesWestern AfricaWestern AsiaWestern EuropeYemenZaireZimbabweAzores
Select to Compare
Race
Ancestry
AfghanAfricanAlaska NativeAlaskan AthabascanAlbanianAleutAlsatianAmericanApacheArabArapahoArgentineanArmenianAssyrian/Chaldean/SyriacAustralianAustrianBahamianBangladeshiBarbadianBasqueBelgianBelizeanBermudanBhutaneseBlackfeetBolivianBrazilianBritishBritish West IndianBulgarianBurmeseCajunCambodianCanadianCape VerdeanCarpatho RusynCelticCentral AmericanCentral American IndianCherokeeCheyenneChickasawChileanChineseChippewaChoctawColombianColvilleComancheCosta RicanCreeCreekCroatianCrowCubanCypriotCzechCzechoslovakianDanishDelawareDominicanDutchDutch West IndianEastern EuropeanEcuadorianEgyptianEnglishEstonianEthiopianEuropeanFijianFilipinoFinnishFrenchFrench American IndianFrench CanadianGermanGerman RussianGhanaianGreekGuamanian/ChamorroGuatemalanGuyaneseHaitianHmongHonduranHopiHoumaHungarianIcelanderIndian (Asian)IndonesianInupiatIranianIraqiIrishIroquoisIsraeliItalianJamaicanJapaneseJordanianKenyanKiowaKoreanLaotianLatvianLebaneseLiberianLithuanianLumbeeLuxembourgerMacedonianMalaysianMalteseMarshalleseMenomineeMexicanMexican American IndianMongolianMoroccanNative HawaiianNavajoNepaleseNew ZealanderNicaraguanNigerianNorthern EuropeanNorwegianOkinawanOsageOttawaPaiutePakistaniPalestinianPanamanianParaguayanPennsylvania GermanPeruvianPimaPolishPortuguesePotawatomiPuebloPuerto RicanPuget Sound SalishRomanianRussianSalvadoranSamoanScandinavianScotch-IrishScottishSeminoleSenegaleseSerbianShoshoneSierra LeoneanSiouxSlavicSlovakSloveneSomaliSouth AfricanSouth AmericanSouth American IndianSoviet UnionSpaniardSpanishSpanish AmericanSpanish American IndianSri LankanSubsaharan AfricanSudaneseSwedishSwissSyrianTaiwaneseThaiTlingit-HaidaTohono O'OdhamTonganTrinidadian and TobagonianTsimshianTurkishU.S. Virgin IslanderUgandanUkrainianUruguayanUteVenezuelanVietnameseWelshWest IndianYakamaYaquiYugoslavianYumanYup'ik
Immigration
NonimmigrantsImmigrantsAfghanistanAfricaAlbaniaArgentinaArmeniaAsiaAustraliaAustriaBahamasBangladeshBarbadosBelarusBelgiumBelizeBoliviaBosnia and HerzegovinaBrazilBulgariaBurma/MyanmarCabo VerdeCambodiaCameroonCanadaCaribbeanCentral AmericaChileChinaColombiaCongoCosta RicaCroatiaCubaCzechoslovakiaDenmarkDominicaDominican RepublicEastern AfricaEastern AsiaEastern EuropeEcuadorEgyptEl SalvadorEnglandEritreaEthiopiaEuropeFijiFranceGermanyGhanaGreeceGrenadaGuatemalaGuyanaHaitiHondurasHong KongHungaryIndiaIndonesiaIranIraqIrelandIsraelItalyJamaicaJapanJordanKazakhstanKenyaKoreaKuwaitLaosLatin AmericaLatviaLebanonLiberiaLithuaniaMalaysiaMexicoMicronesiaMiddle AfricaMoldovaMoroccoNepalNetherlandsNicaraguaNigeriaNorth AmericaNorth MacedoniaNorthern AfricaNorthern EuropeNorwayOceaniaPakistanPanamaPeruPhilippinesPolandPortugalRomaniaRussiaSaudi ArabiaScotlandSenegalSerbiaSierra LeoneSingaporeSomaliaSouth AfricaSouth AmericaSouth Central AsiaSouth Eastern AsiaSouthern EuropeSpainSri LankaSt. Vincent and the GrenadinesSudanSwedenSwitzerlandSyriaTaiwanThailandTrinidad and TobagoTurkeyUgandaUkraineUruguayUzbekistanVenezuelaVietnamWest IndiesWestern AfricaWestern AsiaWestern EuropeYemenZaireZimbabweAzores
2 or more Vehicles in Household
Income
Poverty
Unemployment
Labor Participation
Family Structure
Vehicle Availability
Education Level
Disability

Zimbabwean 2 or more Vehicles in Household
Exceptional

57.2%
2+ VEHICLES AVAILABLE
96.9/ 100
METRIC RATING
113th/ 347
METRIC RANK

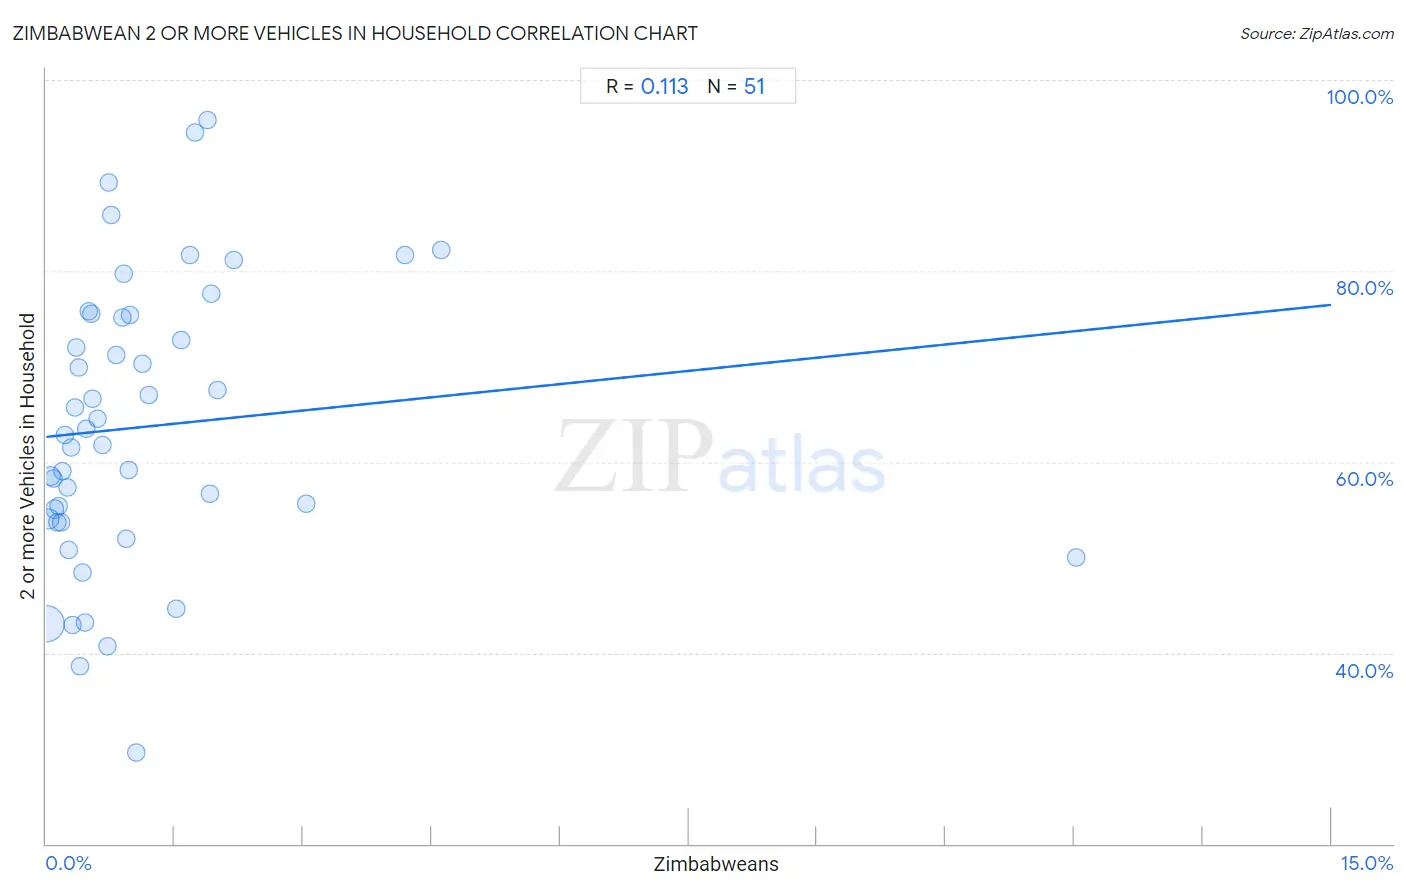
Zimbabwean 2 or more Vehicles in Household Correlation Chart

The statistical analysis conducted on geographies consisting of 69,192,017 people shows a poor positive correlation between the proportion of Zimbabweans and percentage of households with 2 or more vehicles available in the United States with a correlation coefficient (R) of 0.113 and weighted average of 57.2%. On average, for every 1% (one percent) increase in Zimbabweans within a typical geography, there is an increase of 0.92% in percentage of households with 2 or more vehicles available.
Zimbabwean 2 or more Vehicles in Household
It is essential to understand that the correlation between the percentage of Zimbabweans and percentage of households with 2 or more vehicles available does not imply a direct cause-and-effect relationship. It remains uncertain whether the presence of Zimbabweans influences an upward or downward trend in the level of percentage of households with 2 or more vehicles available within an area, or if Zimbabweans simply ended up residing in those areas with higher or lower levels of percentage of households with 2 or more vehicles available due to other factors.

Demographics Similar to Zimbabweans by 2 or more Vehicles in Household

In terms of 2 or more vehicles in household, the demographic groups most similar to Zimbabweans are Immigrants from Lebanon (57.2%, a difference of 0.030%), Chippewa (57.2%, a difference of 0.090%), Immigrants from Jordan (57.2%, a difference of 0.10%), Iraqi (57.1%, a difference of 0.29%), and Greek (57.5%, a difference of 0.42%).
DemographicsRating | Rank2 or more Vehicles in Household
Immigrants from Oceania
98.2
/100
|
#106
Exceptional
57.5%
Immigrants from Netherlands
98.2
/100
|
#107
Exceptional
57.5%
Immigrants from Canada
98.1
/100
|
#108
Exceptional
57.5%
Immigrants from North America
98.1
/100
|
#109
Exceptional
57.5%
Japanese
98.0
/100
|
#110
Exceptional
57.5%
Greeks
98.0
/100
|
#111
Exceptional
57.5%
Pueblo
98.0
/100
|
#112
Exceptional
57.5%
Zimbabweans
96.9
/100
|
#113
Exceptional
57.2%
Immigrants from Lebanon
96.8
/100
|
#114
Exceptional
57.2%
Chippewa
96.6
/100
|
#115
Exceptional
57.2%
Immigrants from Jordan
96.6
/100
|
#116
Exceptional
57.2%
Iraqis
95.8
/100
|
#117
Exceptional
57.1%
Asians
95.1
/100
|
#118
Exceptional
57.0%
Natives/Alaskans
95.0
/100
|
#119
Exceptional
57.0%
Costa Ricans
94.7
/100
|
#120
Exceptional
56.9%

Zimbabwean 2 or more Vehicles in Household Correlation Summary

MeasurementZimbabwean Data2 or more Vehicles in Household Data
Minimum0.0070%29.5%
Maximum12.0%95.8%
Range12.0%66.3%
Mean1.2%63.7%
Median0.65%62.9%
Interquartile 25% (IQ1)0.29%53.7%
Interquartile 75% (IQ3)1.5%75.3%
Interquartile Range (IQR)1.2%21.6%
Standard Deviation (Sample)1.8%14.9%
Standard Deviation (Population)1.8%14.8%

Correlation Details

Zimbabwean PercentileSample Size2 or more Vehicles in Household
[
0.0%
-
0.5%
]
0.0070%
51,358,09843.1%
[
0.0%
-
0.5%
]
0.033%
5,822,33254.0%
[
0.0%
-
0.5%
]
0.055%
4,716,59658.5%
[
0.0%
-
0.5%
]
0.081%
1,658,26658.3%
[
0.0%
-
0.5%
]
0.10%
1,247,08355.0%
[
0.0%
-
0.5%
]
0.13%
800,69753.7%
[
0.0%
-
0.5%
]
0.15%
729,85655.4%
[
0.0%
-
0.5%
]
0.17%
474,85653.7%
[
0.0%
-
0.5%
]
0.19%
549,19659.0%
[
0.0%
-
0.5%
]
0.22%
314,46062.9%
[
0.0%
-
0.5%
]
0.24%
305,50757.4%
[
0.0%
-
0.5%
]
0.27%
189,31350.7%
[
0.0%
-
0.5%
]
0.29%
211,69461.5%
[
0.0%
-
0.5%
]
0.31%
73,52542.9%
[
0.0%
-
0.5%
]
0.33%
38,97965.7%
[
0.0%
-
0.5%
]
0.35%
5,65972.0%
[
0.0%
-
0.5%
]
0.38%
51,36869.9%
[
0.0%
-
0.5%
]
0.40%
28,45838.6%
[
0.0%
-
0.5%
]
0.43%
30,39648.4%
[
0.0%
-
0.5%
]
0.46%
27,29543.1%
[
0.0%
-
0.5%
]
0.47%
145,01263.5%
[
0.0%
-
0.5%
]
0.49%
31,79475.7%
[
0.5%
-
1.0%
]
0.53%
4,74875.5%
[
0.5%
-
1.0%
]
0.53%
2,24666.7%
[
0.5%
-
1.0%
]
0.60%
15,20764.5%
[
0.5%
-
1.0%
]
0.65%
43,70661.8%
[
0.5%
-
1.0%
]
0.72%
10,20940.7%
[
0.5%
-
1.0%
]
0.73%
27389.3%
[
0.5%
-
1.0%
]
0.76%
2,09585.9%
[
0.5%
-
1.0%
]
0.82%
23,80571.2%
[
0.5%
-
1.0%
]
0.90%
36,08975.1%
[
0.5%
-
1.0%
]
0.91%
27,82979.7%
[
0.5%
-
1.0%
]
0.94%
8,63552.0%
[
0.5%
-
1.0%
]
0.96%
29,54559.2%
[
0.5%
-
1.0%
]
0.98%
17,91475.3%
[
1.0%
-
1.5%
]
1.04%
6,99529.5%
[
1.0%
-
1.5%
]
1.12%
36,74970.2%
[
1.0%
-
1.5%
]
1.19%
15,93467.0%
[
1.5%
-
2.0%
]
1.52%
19744.6%
[
1.5%
-
2.0%
]
1.58%
12,04572.8%
[
1.5%
-
2.0%
]
1.67%
95781.7%
[
1.5%
-
2.0%
]
1.74%
8,24294.5%
[
1.5%
-
2.0%
]
1.88%
1,22195.8%
[
1.5%
-
2.0%
]
1.91%
19,84256.7%
[
1.5%
-
2.0%
]
1.93%
15,24477.7%
[
2.0%
-
2.5%
]
2.00%
13,24767.6%
[
2.0%
-
2.5%
]
2.18%
17,26181.1%
[
3.0%
-
3.5%
]
3.04%
6,77555.6%
[
4.0%
-
4.5%
]
4.19%
2,96181.7%
[
4.5%
-
5.0%
]
4.62%
1,47382.2%
[
12.0%
-
12.5%
]
12.03%
13350.0%