West Indian Male Disability

COMPARE

West Indian
Race
Ancestry
AfghanAfricanAlaska NativeAlaskan AthabascanAlbanianAleutAlsatianAmericanApacheArabArapahoArgentineanArmenianAssyrian/Chaldean/SyriacAustralianAustrianBahamianBangladeshiBarbadianBasqueBelgianBelizeanBermudanBhutaneseBlackfeetBolivianBrazilianBritishBritish West IndianBulgarianBurmeseCajunCambodianCanadianCape VerdeanCarpatho RusynCelticCentral AmericanCentral American IndianCherokeeCheyenneChickasawChileanChineseChippewaChoctawColombianColvilleComancheCosta RicanCreeCreekCroatianCrowCubanCypriotCzechCzechoslovakianDanishDelawareDominicanDutchDutch West IndianEastern EuropeanEcuadorianEgyptianEnglishEstonianEthiopianEuropeanFijianFilipinoFinnishFrenchFrench American IndianFrench CanadianGermanGerman RussianGhanaianGreekGuamanian/ChamorroGuatemalanGuyaneseHaitianHmongHonduranHopiHoumaHungarianIcelanderIndian (Asian)IndonesianInupiatIranianIraqiIrishIroquoisIsraeliItalianJamaicanJapaneseJordanianKenyanKiowaKoreanLaotianLatvianLebaneseLiberianLithuanianLumbeeLuxembourgerMacedonianMalaysianMalteseMarshalleseMenomineeMexicanMexican American IndianMongolianMoroccanNative HawaiianNavajoNepaleseNew ZealanderNicaraguanNigerianNorthern EuropeanNorwegianOkinawanOsageOttawaPaiutePakistaniPalestinianPanamanianParaguayanPennsylvania GermanPeruvianPimaPolishPortuguesePotawatomiPuebloPuerto RicanPuget Sound SalishRomanianRussianSalvadoranSamoanScandinavianScotch-IrishScottishSeminoleSenegaleseSerbianShoshoneSierra LeoneanSiouxSlavicSlovakSloveneSomaliSouth AfricanSouth AmericanSouth American IndianSoviet UnionSpaniardSpanishSpanish AmericanSpanish American IndianSri LankanSubsaharan AfricanSudaneseSwedishSwissSyrianTaiwaneseThaiTlingit-HaidaTohono O'OdhamTonganTrinidadian and TobagonianTsimshianTurkishU.S. Virgin IslanderUgandanUkrainianUruguayanUteVenezuelanVietnameseWelshWest IndianYakamaYaquiYugoslavianYumanYup'ikZimbabwean
Immigration
NonimmigrantsImmigrantsAfghanistanAfricaAlbaniaArgentinaArmeniaAsiaAustraliaAustriaBahamasBangladeshBarbadosBelarusBelgiumBelizeBoliviaBosnia and HerzegovinaBrazilBulgariaBurma/MyanmarCabo VerdeCambodiaCameroonCanadaCaribbeanCentral AmericaChileChinaColombiaCongoCosta RicaCroatiaCubaCzechoslovakiaDenmarkDominicaDominican RepublicEastern AfricaEastern AsiaEastern EuropeEcuadorEgyptEl SalvadorEnglandEritreaEthiopiaEuropeFijiFranceGermanyGhanaGreeceGrenadaGuatemalaGuyanaHaitiHondurasHong KongHungaryIndiaIndonesiaIranIraqIrelandIsraelItalyJamaicaJapanJordanKazakhstanKenyaKoreaKuwaitLaosLatin AmericaLatviaLebanonLiberiaLithuaniaMalaysiaMexicoMicronesiaMiddle AfricaMoldovaMoroccoNepalNetherlandsNicaraguaNigeriaNorth AmericaNorth MacedoniaNorthern AfricaNorthern EuropeNorwayOceaniaPakistanPanamaPeruPhilippinesPolandPortugalRomaniaRussiaSaudi ArabiaScotlandSenegalSerbiaSierra LeoneSingaporeSomaliaSouth AfricaSouth AmericaSouth Central AsiaSouth Eastern AsiaSouthern EuropeSpainSri LankaSt. Vincent and the GrenadinesSudanSwedenSwitzerlandSyriaTaiwanThailandTrinidad and TobagoTurkeyUgandaUkraineUruguayUzbekistanVenezuelaVietnamWest IndiesWestern AfricaWestern AsiaWestern EuropeYemenZaireZimbabweAzores
Select to Compare
Race
Ancestry
AfghanAfricanAlaska NativeAlaskan AthabascanAlbanianAleutAlsatianAmericanApacheArabArapahoArgentineanArmenianAssyrian/Chaldean/SyriacAustralianAustrianBahamianBangladeshiBarbadianBasqueBelgianBelizeanBermudanBhutaneseBlackfeetBolivianBrazilianBritishBritish West IndianBulgarianBurmeseCajunCambodianCanadianCape VerdeanCarpatho RusynCelticCentral AmericanCentral American IndianCherokeeCheyenneChickasawChileanChineseChippewaChoctawColombianColvilleComancheCosta RicanCreeCreekCroatianCrowCubanCypriotCzechCzechoslovakianDanishDelawareDominicanDutchDutch West IndianEastern EuropeanEcuadorianEgyptianEnglishEstonianEthiopianEuropeanFijianFilipinoFinnishFrenchFrench American IndianFrench CanadianGermanGerman RussianGhanaianGreekGuamanian/ChamorroGuatemalanGuyaneseHaitianHmongHonduranHopiHoumaHungarianIcelanderIndian (Asian)IndonesianInupiatIranianIraqiIrishIroquoisIsraeliItalianJamaicanJapaneseJordanianKenyanKiowaKoreanLaotianLatvianLebaneseLiberianLithuanianLumbeeLuxembourgerMacedonianMalaysianMalteseMarshalleseMenomineeMexicanMexican American IndianMongolianMoroccanNative HawaiianNavajoNepaleseNew ZealanderNicaraguanNigerianNorthern EuropeanNorwegianOkinawanOsageOttawaPaiutePakistaniPalestinianPanamanianParaguayanPennsylvania GermanPeruvianPimaPolishPortuguesePotawatomiPuebloPuerto RicanPuget Sound SalishRomanianRussianSalvadoranSamoanScandinavianScotch-IrishScottishSeminoleSenegaleseSerbianShoshoneSierra LeoneanSiouxSlavicSlovakSloveneSomaliSouth AfricanSouth AmericanSouth American IndianSoviet UnionSpaniardSpanishSpanish AmericanSpanish American IndianSri LankanSubsaharan AfricanSudaneseSwedishSwissSyrianTaiwaneseThaiTlingit-HaidaTohono O'OdhamTonganTrinidadian and TobagonianTsimshianTurkishU.S. Virgin IslanderUgandanUkrainianUruguayanUteVenezuelanVietnameseWelshYakamaYaquiYugoslavianYumanYup'ikZimbabwean
Immigration
NonimmigrantsImmigrantsAfghanistanAfricaAlbaniaArgentinaArmeniaAsiaAustraliaAustriaBahamasBangladeshBarbadosBelarusBelgiumBelizeBoliviaBosnia and HerzegovinaBrazilBulgariaBurma/MyanmarCabo VerdeCambodiaCameroonCanadaCaribbeanCentral AmericaChileChinaColombiaCongoCosta RicaCroatiaCubaCzechoslovakiaDenmarkDominicaDominican RepublicEastern AfricaEastern AsiaEastern EuropeEcuadorEgyptEl SalvadorEnglandEritreaEthiopiaEuropeFijiFranceGermanyGhanaGreeceGrenadaGuatemalaGuyanaHaitiHondurasHong KongHungaryIndiaIndonesiaIranIraqIrelandIsraelItalyJamaicaJapanJordanKazakhstanKenyaKoreaKuwaitLaosLatin AmericaLatviaLebanonLiberiaLithuaniaMalaysiaMexicoMicronesiaMiddle AfricaMoldovaMoroccoNepalNetherlandsNicaraguaNigeriaNorth AmericaNorth MacedoniaNorthern AfricaNorthern EuropeNorwayOceaniaPakistanPanamaPeruPhilippinesPolandPortugalRomaniaRussiaSaudi ArabiaScotlandSenegalSerbiaSierra LeoneSingaporeSomaliaSouth AfricaSouth AmericaSouth Central AsiaSouth Eastern AsiaSouthern EuropeSpainSri LankaSt. Vincent and the GrenadinesSudanSwedenSwitzerlandSyriaTaiwanThailandTrinidad and TobagoTurkeyUgandaUkraineUruguayUzbekistanVenezuelaVietnamWest IndiesWestern AfricaWestern AsiaWestern EuropeYemenZaireZimbabweAzores
Male Disability
Income
Poverty
Unemployment
Labor Participation
Family Structure
Vehicle Availability
Education Level
Disability

West Indian Male Disability
Poor

11.4%
DISABILITY | MALES
18.4/ 100
METRIC RATING
196th/ 347
METRIC RANK

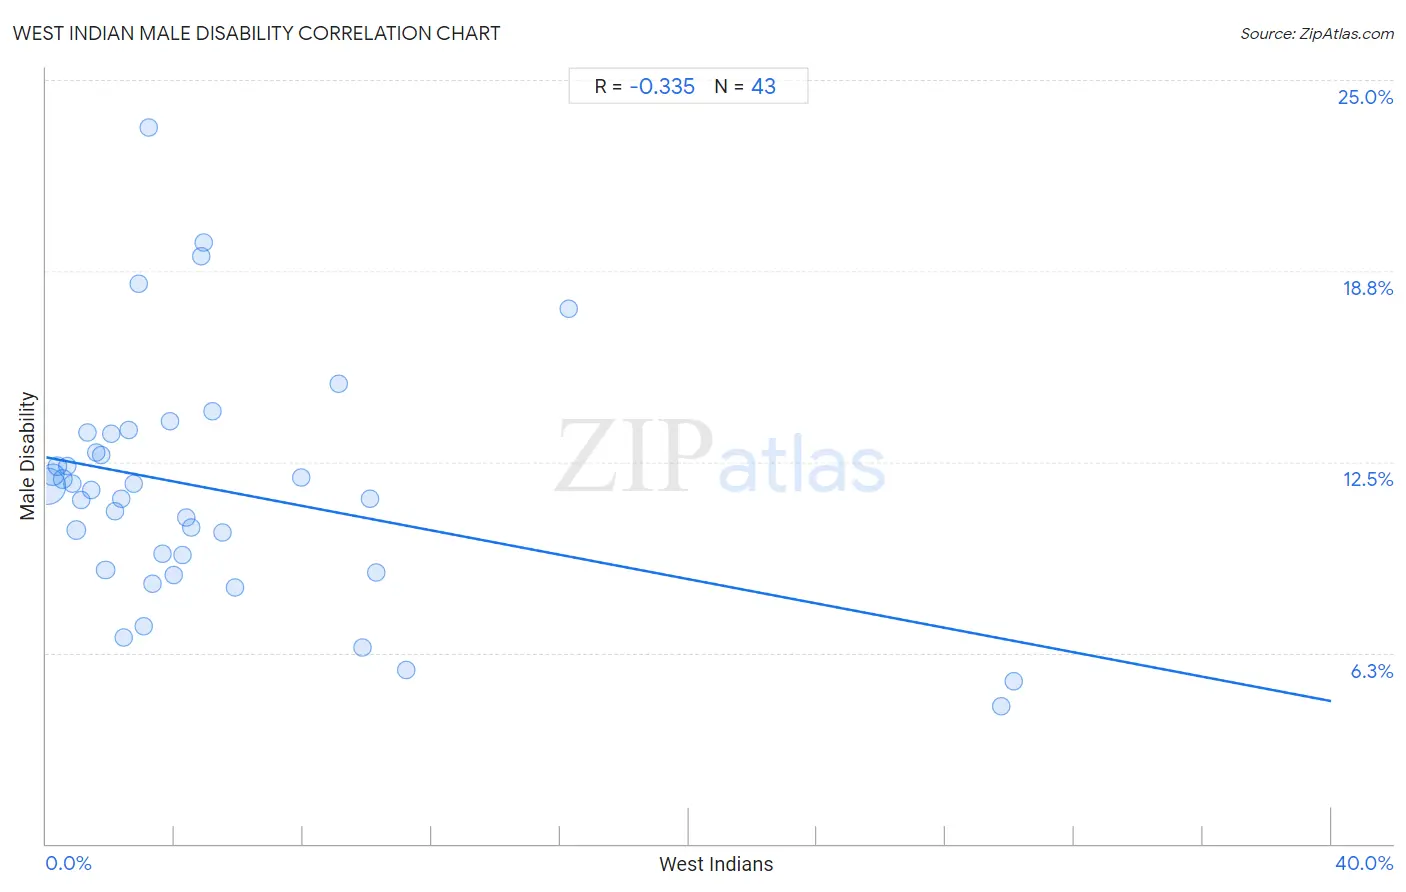
West Indian Male Disability Correlation Chart

The statistical analysis conducted on geographies consisting of 254,013,623 people shows a mild negative correlation between the proportion of West Indians and percentage of males with a disability in the United States with a correlation coefficient (R) of -0.335 and weighted average of 11.4%. On average, for every 1% (one percent) increase in West Indians within a typical geography, there is a decrease of 0.20% in percentage of males with a disability.
West Indian Male Disability
It is essential to understand that the correlation between the percentage of West Indians and percentage of males with a disability does not imply a direct cause-and-effect relationship. It remains uncertain whether the presence of West Indians influences an upward or downward trend in the level of percentage of males with a disability within an area, or if West Indians simply ended up residing in those areas with higher or lower levels of percentage of males with a disability due to other factors.

Demographics Similar to West Indians by Male Disability

In terms of male disability, the demographic groups most similar to West Indians are Somali (11.4%, a difference of 0.020%), Immigrants from Jamaica (11.5%, a difference of 0.20%), Immigrants from Oceania (11.4%, a difference of 0.22%), Belizean (11.4%, a difference of 0.24%), and Lebanese (11.5%, a difference of 0.29%).
DemographicsRating | RankMale Disability
Immigrants from Netherlands
25.9
/100
|
#189
Fair
11.4%
Immigrants from Bosnia and Herzegovina
25.4
/100
|
#190
Fair
11.4%
Senegalese
23.2
/100
|
#191
Fair
11.4%
Assyrians/Chaldeans/Syriacs
23.2
/100
|
#192
Fair
11.4%
Greeks
22.2
/100
|
#193
Fair
11.4%
Belizeans
21.2
/100
|
#194
Fair
11.4%
Immigrants from Oceania
20.9
/100
|
#195
Fair
11.4%
West Indians
18.4
/100
|
#196
Poor
11.4%
Somalis
18.2
/100
|
#197
Poor
11.4%
Immigrants from Jamaica
16.3
/100
|
#198
Poor
11.5%
Lebanese
15.4
/100
|
#199
Poor
11.5%
Immigrants from Iraq
13.0
/100
|
#200
Poor
11.5%
Immigrants from Panama
13.0
/100
|
#201
Poor
11.5%
Immigrants from Mexico
12.6
/100
|
#202
Poor
11.5%
Jamaicans
10.9
/100
|
#203
Poor
11.5%

West Indian Male Disability Correlation Summary

MeasurementWest Indian DataMale Disability Data
Minimum0.054%4.5%
Maximum30.1%23.5%
Range30.1%19.0%
Mean5.2%11.6%
Median3.2%11.6%
Interquartile 25% (IQ1)1.6%8.9%
Interquartile 75% (IQ3)5.5%13.4%
Interquartile Range (IQR)3.9%4.5%
Standard Deviation (Sample)6.5%3.9%
Standard Deviation (Population)6.4%3.8%

Correlation Details

West Indian PercentileSample SizeMale Disability
[
0.0%
-
0.5%
]
0.054%
173,629,35511.7%
[
0.0%
-
0.5%
]
0.21%
39,798,89712.1%
[
0.0%
-
0.5%
]
0.35%
13,177,81512.4%
[
0.5%
-
1.0%
]
0.51%
6,142,22211.9%
[
0.5%
-
1.0%
]
0.66%
4,079,87712.4%
[
0.5%
-
1.0%
]
0.82%
2,016,75911.8%
[
0.5%
-
1.0%
]
0.95%
10,358,68610.3%
[
1.0%
-
1.5%
]
1.09%
1,093,10911.2%
[
1.0%
-
1.5%
]
1.28%
571,75813.5%
[
1.0%
-
1.5%
]
1.41%
307,46711.6%
[
1.5%
-
2.0%
]
1.56%
439,17412.8%
[
1.5%
-
2.0%
]
1.71%
336,88612.7%
[
1.5%
-
2.0%
]
1.85%
186,4708.9%
[
2.0%
-
2.5%
]
2.02%
135,81913.4%
[
2.0%
-
2.5%
]
2.15%
200,85310.9%
[
2.0%
-
2.5%
]
2.32%
142,29411.3%
[
2.0%
-
2.5%
]
2.42%
208,2136.7%
[
2.5%
-
3.0%
]
2.59%
150,46313.6%
[
2.5%
-
3.0%
]
2.73%
286,76011.8%
[
2.5%
-
3.0%
]
2.88%
48,10718.3%
[
3.0%
-
3.5%
]
3.05%
5,3447.1%
[
3.0%
-
3.5%
]
3.19%
14,76323.5%
[
3.0%
-
3.5%
]
3.32%
190,4748.5%
[
3.5%
-
4.0%
]
3.61%
75,7259.5%
[
3.5%
-
4.0%
]
3.85%
4,64813.8%
[
3.5%
-
4.0%
]
3.98%
69,3758.8%
[
4.0%
-
4.5%
]
4.23%
1,1589.4%
[
4.0%
-
4.5%
]
4.36%
8,16410.7%
[
4.5%
-
5.0%
]
4.52%
22,12210.3%
[
4.5%
-
5.0%
]
4.81%
3,18119.2%
[
4.5%
-
5.0%
]
4.91%
3,11419.7%
[
5.0%
-
5.5%
]
5.17%
6,85114.1%
[
5.0%
-
5.5%
]
5.50%
32,29610.2%
[
5.5%
-
6.0%
]
5.88%
85,4258.4%
[
7.5%
-
8.0%
]
7.93%
83,12512.0%
[
9.0%
-
9.5%
]
9.09%
28615.1%
[
9.5%
-
10.0%
]
9.85%
3,1176.4%
[
10.0%
-
10.5%
]
10.06%
10,52611.3%
[
10.0%
-
10.5%
]
10.27%
78,5068.9%
[
11.0%
-
11.5%
]
11.21%
5715.7%
[
16.0%
-
16.5%
]
16.26%
32617.5%
[
29.5%
-
30.0%
]
29.74%
1,7824.5%
[
30.0%
-
30.5%
]
30.11%
1,7605.3%