Tongan College, 1 year or more

COMPARE

Tongan
Race
Ancestry
AfghanAfricanAlaska NativeAlaskan AthabascanAlbanianAleutAlsatianAmericanApacheArabArapahoArgentineanArmenianAssyrian/Chaldean/SyriacAustralianAustrianBahamianBangladeshiBarbadianBasqueBelgianBelizeanBermudanBhutaneseBlackfeetBolivianBrazilianBritishBritish West IndianBulgarianBurmeseCajunCambodianCanadianCape VerdeanCarpatho RusynCelticCentral AmericanCentral American IndianCherokeeCheyenneChickasawChileanChineseChippewaChoctawColombianColvilleComancheCosta RicanCreeCreekCroatianCrowCubanCypriotCzechCzechoslovakianDanishDelawareDominicanDutchDutch West IndianEastern EuropeanEcuadorianEgyptianEnglishEstonianEthiopianEuropeanFijianFilipinoFinnishFrenchFrench American IndianFrench CanadianGermanGerman RussianGhanaianGreekGuamanian/ChamorroGuatemalanGuyaneseHaitianHmongHonduranHopiHoumaHungarianIcelanderIndian (Asian)IndonesianInupiatIranianIraqiIrishIroquoisIsraeliItalianJamaicanJapaneseJordanianKenyanKiowaKoreanLaotianLatvianLebaneseLiberianLithuanianLumbeeLuxembourgerMacedonianMalaysianMalteseMarshalleseMenomineeMexicanMexican American IndianMongolianMoroccanNative HawaiianNavajoNepaleseNew ZealanderNicaraguanNigerianNorthern EuropeanNorwegianOkinawanOsageOttawaPaiutePakistaniPalestinianPanamanianParaguayanPennsylvania GermanPeruvianPimaPolishPortuguesePotawatomiPuebloPuerto RicanPuget Sound SalishRomanianRussianSalvadoranSamoanScandinavianScotch-IrishScottishSeminoleSenegaleseSerbianShoshoneSierra LeoneanSiouxSlavicSlovakSloveneSomaliSouth AfricanSouth AmericanSouth American IndianSoviet UnionSpaniardSpanishSpanish AmericanSpanish American IndianSri LankanSubsaharan AfricanSudaneseSwedishSwissSyrianTaiwaneseThaiTlingit-HaidaTohono O'OdhamTonganTrinidadian and TobagonianTsimshianTurkishU.S. Virgin IslanderUgandanUkrainianUruguayanUteVenezuelanVietnameseWelshWest IndianYakamaYaquiYugoslavianYumanYup'ikZimbabwean
Immigration
NonimmigrantsImmigrantsAfghanistanAfricaAlbaniaArgentinaArmeniaAsiaAustraliaAustriaBahamasBangladeshBarbadosBelarusBelgiumBelizeBoliviaBosnia and HerzegovinaBrazilBulgariaBurma/MyanmarCabo VerdeCambodiaCameroonCanadaCaribbeanCentral AmericaChileChinaColombiaCongoCosta RicaCroatiaCubaCzechoslovakiaDenmarkDominicaDominican RepublicEastern AfricaEastern AsiaEastern EuropeEcuadorEgyptEl SalvadorEnglandEritreaEthiopiaEuropeFijiFranceGermanyGhanaGreeceGrenadaGuatemalaGuyanaHaitiHondurasHong KongHungaryIndiaIndonesiaIranIraqIrelandIsraelItalyJamaicaJapanJordanKazakhstanKenyaKoreaKuwaitLaosLatin AmericaLatviaLebanonLiberiaLithuaniaMalaysiaMexicoMicronesiaMiddle AfricaMoldovaMoroccoNepalNetherlandsNicaraguaNigeriaNorth AmericaNorth MacedoniaNorthern AfricaNorthern EuropeNorwayOceaniaPakistanPanamaPeruPhilippinesPolandPortugalRomaniaRussiaSaudi ArabiaScotlandSenegalSerbiaSierra LeoneSingaporeSomaliaSouth AfricaSouth AmericaSouth Central AsiaSouth Eastern AsiaSouthern EuropeSpainSri LankaSt. Vincent and the GrenadinesSudanSwedenSwitzerlandSyriaTaiwanThailandTrinidad and TobagoTurkeyUgandaUkraineUruguayUzbekistanVenezuelaVietnamWest IndiesWestern AfricaWestern AsiaWestern EuropeYemenZaireZimbabweAzores
Select to Compare
Race
Ancestry
AfghanAfricanAlaska NativeAlaskan AthabascanAlbanianAleutAlsatianAmericanApacheArabArapahoArgentineanArmenianAssyrian/Chaldean/SyriacAustralianAustrianBahamianBangladeshiBarbadianBasqueBelgianBelizeanBermudanBhutaneseBlackfeetBolivianBrazilianBritishBritish West IndianBulgarianBurmeseCajunCambodianCanadianCape VerdeanCarpatho RusynCelticCentral AmericanCentral American IndianCherokeeCheyenneChickasawChileanChineseChippewaChoctawColombianColvilleComancheCosta RicanCreeCreekCroatianCrowCubanCypriotCzechCzechoslovakianDanishDelawareDominicanDutchDutch West IndianEastern EuropeanEcuadorianEgyptianEnglishEstonianEthiopianEuropeanFijianFilipinoFinnishFrenchFrench American IndianFrench CanadianGermanGerman RussianGhanaianGreekGuamanian/ChamorroGuatemalanGuyaneseHaitianHmongHonduranHopiHoumaHungarianIcelanderIndian (Asian)IndonesianInupiatIranianIraqiIrishIroquoisIsraeliItalianJamaicanJapaneseJordanianKenyanKiowaKoreanLaotianLatvianLebaneseLiberianLithuanianLumbeeLuxembourgerMacedonianMalaysianMalteseMarshalleseMenomineeMexicanMexican American IndianMongolianMoroccanNative HawaiianNavajoNepaleseNew ZealanderNicaraguanNigerianNorthern EuropeanNorwegianOkinawanOsageOttawaPaiutePakistaniPalestinianPanamanianParaguayanPennsylvania GermanPeruvianPimaPolishPortuguesePotawatomiPuebloPuerto RicanPuget Sound SalishRomanianRussianSalvadoranSamoanScandinavianScotch-IrishScottishSeminoleSenegaleseSerbianShoshoneSierra LeoneanSiouxSlavicSlovakSloveneSomaliSouth AfricanSouth AmericanSouth American IndianSoviet UnionSpaniardSpanishSpanish AmericanSpanish American IndianSri LankanSubsaharan AfricanSudaneseSwedishSwissSyrianTaiwaneseThaiTlingit-HaidaTohono O'OdhamTrinidadian and TobagonianTsimshianTurkishU.S. Virgin IslanderUgandanUkrainianUruguayanUteVenezuelanVietnameseWelshWest IndianYakamaYaquiYugoslavianYumanYup'ikZimbabwean
Immigration
NonimmigrantsImmigrantsAfghanistanAfricaAlbaniaArgentinaArmeniaAsiaAustraliaAustriaBahamasBangladeshBarbadosBelarusBelgiumBelizeBoliviaBosnia and HerzegovinaBrazilBulgariaBurma/MyanmarCabo VerdeCambodiaCameroonCanadaCaribbeanCentral AmericaChileChinaColombiaCongoCosta RicaCroatiaCubaCzechoslovakiaDenmarkDominicaDominican RepublicEastern AfricaEastern AsiaEastern EuropeEcuadorEgyptEl SalvadorEnglandEritreaEthiopiaEuropeFijiFranceGermanyGhanaGreeceGrenadaGuatemalaGuyanaHaitiHondurasHong KongHungaryIndiaIndonesiaIranIraqIrelandIsraelItalyJamaicaJapanJordanKazakhstanKenyaKoreaKuwaitLaosLatin AmericaLatviaLebanonLiberiaLithuaniaMalaysiaMexicoMicronesiaMiddle AfricaMoldovaMoroccoNepalNetherlandsNicaraguaNigeriaNorth AmericaNorth MacedoniaNorthern AfricaNorthern EuropeNorwayOceaniaPakistanPanamaPeruPhilippinesPolandPortugalRomaniaRussiaSaudi ArabiaScotlandSenegalSerbiaSierra LeoneSingaporeSomaliaSouth AfricaSouth AmericaSouth Central AsiaSouth Eastern AsiaSouthern EuropeSpainSri LankaSt. Vincent and the GrenadinesSudanSwedenSwitzerlandSyriaTaiwanThailandTrinidad and TobagoTurkeyUgandaUkraineUruguayUzbekistanVenezuelaVietnamWest IndiesWestern AfricaWestern AsiaWestern EuropeYemenZaireZimbabweAzores
College, 1 year or more
Income
Poverty
Unemployment
Labor Participation
Family Structure
Vehicle Availability
Education Level
Disability

Tongan College, 1 year or more
Poor

57.8%
COLLEGE, 1 YEAR OR MORE
11.6/ 100
METRIC RATING
215th/ 347
METRIC RANK

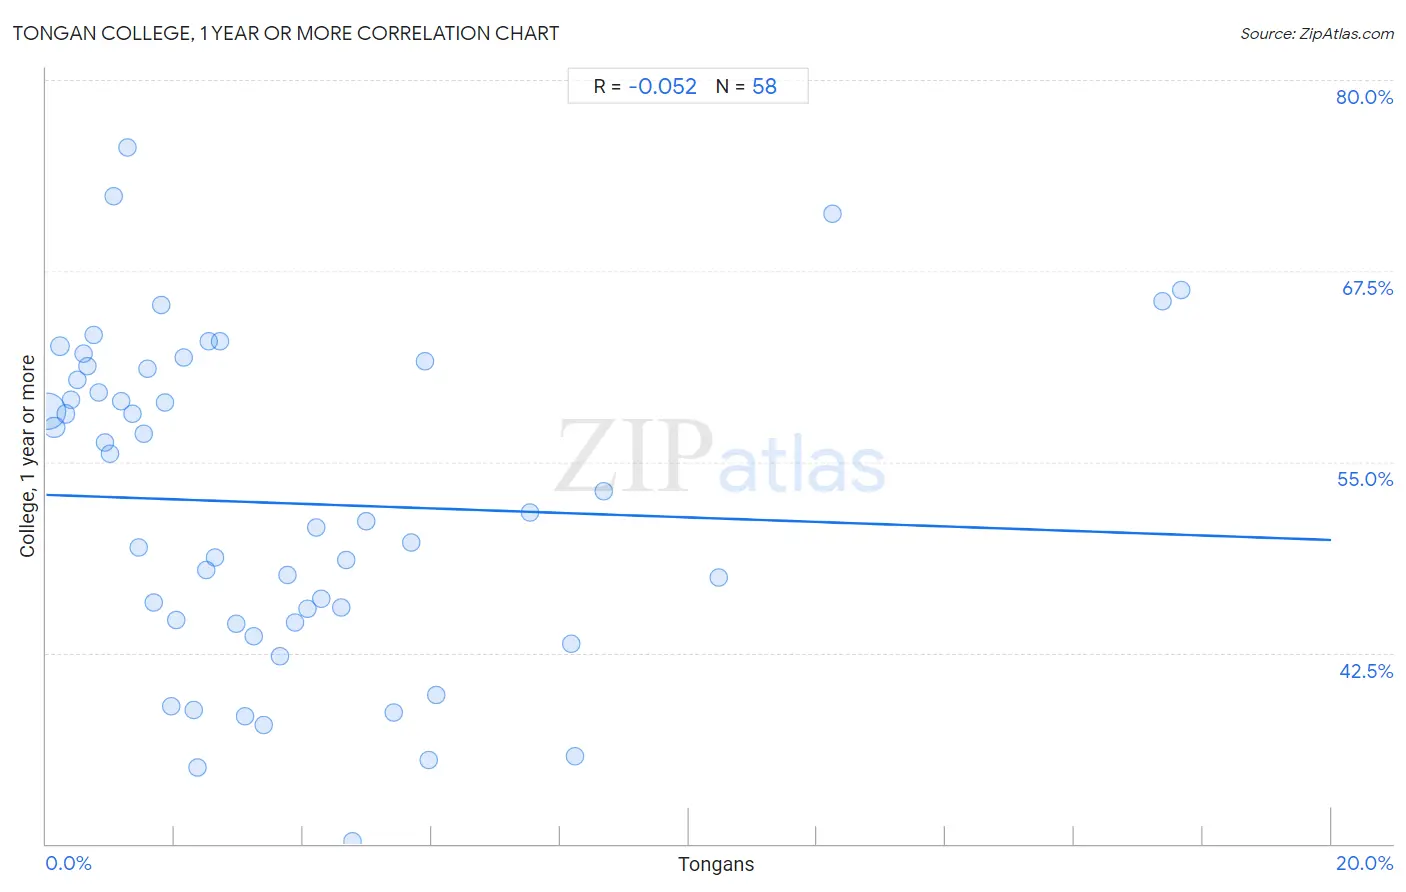
Tongan College, 1 year or more Correlation Chart

The statistical analysis conducted on geographies consisting of 102,908,759 people shows a slight negative correlation between the proportion of Tongans and percentage of population with at least college, 1 year or more education in the United States with a correlation coefficient (R) of -0.052 and weighted average of 57.8%. On average, for every 1% (one percent) increase in Tongans within a typical geography, there is a decrease of 0.15% in percentage of population with at least college, 1 year or more education.
Tongan College, 1 year or more
It is essential to understand that the correlation between the percentage of Tongans and percentage of population with at least college, 1 year or more education does not imply a direct cause-and-effect relationship. It remains uncertain whether the presence of Tongans influences an upward or downward trend in the level of percentage of population with at least college, 1 year or more education within an area, or if Tongans simply ended up residing in those areas with higher or lower levels of percentage of population with at least college, 1 year or more education due to other factors.

Demographics Similar to Tongans by College, 1 year or more

In terms of college, 1 year or more, the demographic groups most similar to Tongans are Immigrants from Colombia (57.8%, a difference of 0.0%), Immigrants from Senegal (57.8%, a difference of 0.040%), French Canadian (57.8%, a difference of 0.040%), Immigrants from Peru (57.7%, a difference of 0.13%), and Immigrants from Nigeria (57.9%, a difference of 0.21%).
DemographicsRating | RankCollege, 1 year or more
Immigrants from Uruguay
15.2
/100
|
#208
Poor
58.1%
Immigrants from Middle Africa
14.0
/100
|
#209
Poor
58.0%
Tsimshian
13.5
/100
|
#210
Poor
57.9%
Immigrants from Nigeria
13.3
/100
|
#211
Poor
57.9%
Immigrants from Senegal
11.8
/100
|
#212
Poor
57.8%
French Canadians
11.8
/100
|
#213
Poor
57.8%
Immigrants from Colombia
11.6
/100
|
#214
Poor
57.8%
Tongans
11.6
/100
|
#215
Poor
57.8%
Immigrants from Peru
10.6
/100
|
#216
Poor
57.7%
Immigrants from Panama
9.1
/100
|
#217
Tragic
57.6%
Native Hawaiians
9.0
/100
|
#218
Tragic
57.6%
Whites/Caucasians
8.7
/100
|
#219
Tragic
57.6%
Immigrants from Costa Rica
8.0
/100
|
#220
Tragic
57.5%
Immigrants from Ghana
7.7
/100
|
#221
Tragic
57.4%
Sub-Saharan Africans
6.1
/100
|
#222
Tragic
57.3%

Tongan College, 1 year or more Correlation Summary

MeasurementTongan DataCollege, 1 year or more Data
Minimum0.023%30.2%
Maximum17.7%75.6%
Range17.6%45.4%
Mean3.7%52.3%
Median2.6%51.4%
Interquartile 25% (IQ1)1.3%44.5%
Interquartile 75% (IQ3)4.8%61.1%
Interquartile Range (IQR)3.5%16.6%
Standard Deviation (Sample)3.7%10.5%
Standard Deviation (Population)3.7%10.5%

Correlation Details

Tongan PercentileSample SizeCollege, 1 year or more
[
0.0%
-
0.5%
]
0.023%
74,472,66358.3%
[
0.0%
-
0.5%
]
0.13%
10,599,85557.2%
[
0.0%
-
0.5%
]
0.22%
5,205,76462.5%
[
0.0%
-
0.5%
]
0.31%
3,571,82858.1%
[
0.0%
-
0.5%
]
0.39%
1,855,23459.0%
[
0.0%
-
0.5%
]
0.48%
1,299,94760.4%
[
0.5%
-
1.0%
]
0.58%
1,279,27862.1%
[
0.5%
-
1.0%
]
0.64%
669,68761.3%
[
0.5%
-
1.0%
]
0.74%
615,60463.3%
[
0.5%
-
1.0%
]
0.82%
305,90159.5%
[
0.5%
-
1.0%
]
0.91%
241,28156.3%
[
1.0%
-
1.5%
]
1.00%
230,15455.6%
[
1.0%
-
1.5%
]
1.05%
430,15672.4%
[
1.0%
-
1.5%
]
1.16%
586,53758.9%
[
1.0%
-
1.5%
]
1.27%
88,80575.6%
[
1.0%
-
1.5%
]
1.34%
76,40858.2%
[
1.0%
-
1.5%
]
1.43%
235,69049.4%
[
1.5%
-
2.0%
]
1.53%
70,74956.8%
[
1.5%
-
2.0%
]
1.58%
99,72961.1%
[
1.5%
-
2.0%
]
1.68%
62,01945.8%
[
1.5%
-
2.0%
]
1.79%
100,73065.3%
[
1.5%
-
2.0%
]
1.84%
11,94358.9%
[
1.5%
-
2.0%
]
1.94%
18,78939.0%
[
2.0%
-
2.5%
]
2.02%
74,25044.7%
[
2.0%
-
2.5%
]
2.13%
100,99261.8%
[
2.0%
-
2.5%
]
2.29%
179,96238.7%
[
2.0%
-
2.5%
]
2.36%
48,69235.0%
[
2.0%
-
2.5%
]
2.49%
23,70848.0%
[
2.5%
-
3.0%
]
2.52%
35,39262.9%
[
2.5%
-
3.0%
]
2.62%
3,39748.7%
[
2.5%
-
3.0%
]
2.70%
56,70962.9%
[
2.5%
-
3.0%
]
2.97%
13,28144.4%
[
3.0%
-
3.5%
]
3.09%
26,95438.4%
[
3.0%
-
3.5%
]
3.24%
92,16043.5%
[
3.0%
-
3.5%
]
3.39%
29537.8%
[
3.5%
-
4.0%
]
3.63%
3,74642.3%
[
3.5%
-
4.0%
]
3.75%
85347.6%
[
3.5%
-
4.0%
]
3.86%
1,52744.5%
[
4.0%
-
4.5%
]
4.07%
6,72445.4%
[
4.0%
-
4.5%
]
4.21%
4,70850.7%
[
4.0%
-
4.5%
]
4.29%
30,98346.0%
[
4.5%
-
5.0%
]
4.59%
12,90645.5%
[
4.5%
-
5.0%
]
4.68%
4,55548.6%
[
4.5%
-
5.0%
]
4.76%
8430.2%
[
4.5%
-
5.0%
]
4.97%
23,21451.1%
[
5.0%
-
5.5%
]
5.40%
72238.6%
[
5.5%
-
6.0%
]
5.68%
3,59349.7%
[
5.5%
-
6.0%
]
5.89%
1,64861.6%
[
5.5%
-
6.0%
]
5.95%
3,98635.5%
[
6.0%
-
6.5%
]
6.06%
69339.7%
[
7.5%
-
8.0%
]
7.54%
6,77951.6%
[
8.0%
-
8.5%
]
8.16%
39243.1%
[
8.0%
-
8.5%
]
8.24%
51035.8%
[
8.5%
-
9.0%
]
8.68%
2,74253.1%
[
10.0%
-
10.5%
]
10.47%
2,27447.4%
[
12.0%
-
12.5%
]
12.24%
39271.2%
[
17.0%
-
17.5%
]
17.37%
5,41165.5%
[
17.5%
-
18.0%
]
17.67%
5,77466.3%