Tongan Median Household Income

COMPARE

Tongan
Race
Ancestry
AfghanAfricanAlaska NativeAlaskan AthabascanAlbanianAleutAlsatianAmericanApacheArabArapahoArgentineanArmenianAssyrian/Chaldean/SyriacAustralianAustrianBahamianBangladeshiBarbadianBasqueBelgianBelizeanBermudanBhutaneseBlackfeetBolivianBrazilianBritishBritish West IndianBulgarianBurmeseCajunCambodianCanadianCape VerdeanCarpatho RusynCelticCentral AmericanCentral American IndianCherokeeCheyenneChickasawChileanChineseChippewaChoctawColombianColvilleComancheCosta RicanCreeCreekCroatianCrowCubanCypriotCzechCzechoslovakianDanishDelawareDominicanDutchDutch West IndianEastern EuropeanEcuadorianEgyptianEnglishEstonianEthiopianEuropeanFijianFilipinoFinnishFrenchFrench American IndianFrench CanadianGermanGerman RussianGhanaianGreekGuamanian/ChamorroGuatemalanGuyaneseHaitianHmongHonduranHopiHoumaHungarianIcelanderIndian (Asian)IndonesianInupiatIranianIraqiIrishIroquoisIsraeliItalianJamaicanJapaneseJordanianKenyanKiowaKoreanLaotianLatvianLebaneseLiberianLithuanianLumbeeLuxembourgerMacedonianMalaysianMalteseMarshalleseMenomineeMexicanMexican American IndianMongolianMoroccanNative HawaiianNavajoNepaleseNew ZealanderNicaraguanNigerianNorthern EuropeanNorwegianOkinawanOsageOttawaPaiutePakistaniPalestinianPanamanianParaguayanPennsylvania GermanPeruvianPimaPolishPortuguesePotawatomiPuebloPuerto RicanPuget Sound SalishRomanianRussianSalvadoranSamoanScandinavianScotch-IrishScottishSeminoleSenegaleseSerbianShoshoneSierra LeoneanSiouxSlavicSlovakSloveneSomaliSouth AfricanSouth AmericanSouth American IndianSoviet UnionSpaniardSpanishSpanish AmericanSpanish American IndianSri LankanSubsaharan AfricanSudaneseSwedishSwissSyrianTaiwaneseThaiTlingit-HaidaTohono O'OdhamTonganTrinidadian and TobagonianTsimshianTurkishU.S. Virgin IslanderUgandanUkrainianUruguayanUteVenezuelanVietnameseWelshWest IndianYakamaYaquiYugoslavianYumanYup'ikZimbabwean
Immigration
NonimmigrantsImmigrantsAfghanistanAfricaAlbaniaArgentinaArmeniaAsiaAustraliaAustriaBahamasBangladeshBarbadosBelarusBelgiumBelizeBoliviaBosnia and HerzegovinaBrazilBulgariaBurma/MyanmarCabo VerdeCambodiaCameroonCanadaCaribbeanCentral AmericaChileChinaColombiaCongoCosta RicaCroatiaCubaCzechoslovakiaDenmarkDominicaDominican RepublicEastern AfricaEastern AsiaEastern EuropeEcuadorEgyptEl SalvadorEnglandEritreaEthiopiaEuropeFijiFranceGermanyGhanaGreeceGrenadaGuatemalaGuyanaHaitiHondurasHong KongHungaryIndiaIndonesiaIranIraqIrelandIsraelItalyJamaicaJapanJordanKazakhstanKenyaKoreaKuwaitLaosLatin AmericaLatviaLebanonLiberiaLithuaniaMalaysiaMexicoMicronesiaMiddle AfricaMoldovaMoroccoNepalNetherlandsNicaraguaNigeriaNorth AmericaNorth MacedoniaNorthern AfricaNorthern EuropeNorwayOceaniaPakistanPanamaPeruPhilippinesPolandPortugalRomaniaRussiaSaudi ArabiaScotlandSenegalSerbiaSierra LeoneSingaporeSomaliaSouth AfricaSouth AmericaSouth Central AsiaSouth Eastern AsiaSouthern EuropeSpainSri LankaSt. Vincent and the GrenadinesSudanSwedenSwitzerlandSyriaTaiwanThailandTrinidad and TobagoTurkeyUgandaUkraineUruguayUzbekistanVenezuelaVietnamWest IndiesWestern AfricaWestern AsiaWestern EuropeYemenZaireZimbabweAzores
Select to Compare
Race
Ancestry
AfghanAfricanAlaska NativeAlaskan AthabascanAlbanianAleutAlsatianAmericanApacheArabArapahoArgentineanArmenianAssyrian/Chaldean/SyriacAustralianAustrianBahamianBangladeshiBarbadianBasqueBelgianBelizeanBermudanBhutaneseBlackfeetBolivianBrazilianBritishBritish West IndianBulgarianBurmeseCajunCambodianCanadianCape VerdeanCarpatho RusynCelticCentral AmericanCentral American IndianCherokeeCheyenneChickasawChileanChineseChippewaChoctawColombianColvilleComancheCosta RicanCreeCreekCroatianCrowCubanCypriotCzechCzechoslovakianDanishDelawareDominicanDutchDutch West IndianEastern EuropeanEcuadorianEgyptianEnglishEstonianEthiopianEuropeanFijianFilipinoFinnishFrenchFrench American IndianFrench CanadianGermanGerman RussianGhanaianGreekGuamanian/ChamorroGuatemalanGuyaneseHaitianHmongHonduranHopiHoumaHungarianIcelanderIndian (Asian)IndonesianInupiatIranianIraqiIrishIroquoisIsraeliItalianJamaicanJapaneseJordanianKenyanKiowaKoreanLaotianLatvianLebaneseLiberianLithuanianLumbeeLuxembourgerMacedonianMalaysianMalteseMarshalleseMenomineeMexicanMexican American IndianMongolianMoroccanNative HawaiianNavajoNepaleseNew ZealanderNicaraguanNigerianNorthern EuropeanNorwegianOkinawanOsageOttawaPaiutePakistaniPalestinianPanamanianParaguayanPennsylvania GermanPeruvianPimaPolishPortuguesePotawatomiPuebloPuerto RicanPuget Sound SalishRomanianRussianSalvadoranSamoanScandinavianScotch-IrishScottishSeminoleSenegaleseSerbianShoshoneSierra LeoneanSiouxSlavicSlovakSloveneSomaliSouth AfricanSouth AmericanSouth American IndianSoviet UnionSpaniardSpanishSpanish AmericanSpanish American IndianSri LankanSubsaharan AfricanSudaneseSwedishSwissSyrianTaiwaneseThaiTlingit-HaidaTohono O'OdhamTrinidadian and TobagonianTsimshianTurkishU.S. Virgin IslanderUgandanUkrainianUruguayanUteVenezuelanVietnameseWelshWest IndianYakamaYaquiYugoslavianYumanYup'ikZimbabwean
Immigration
NonimmigrantsImmigrantsAfghanistanAfricaAlbaniaArgentinaArmeniaAsiaAustraliaAustriaBahamasBangladeshBarbadosBelarusBelgiumBelizeBoliviaBosnia and HerzegovinaBrazilBulgariaBurma/MyanmarCabo VerdeCambodiaCameroonCanadaCaribbeanCentral AmericaChileChinaColombiaCongoCosta RicaCroatiaCubaCzechoslovakiaDenmarkDominicaDominican RepublicEastern AfricaEastern AsiaEastern EuropeEcuadorEgyptEl SalvadorEnglandEritreaEthiopiaEuropeFijiFranceGermanyGhanaGreeceGrenadaGuatemalaGuyanaHaitiHondurasHong KongHungaryIndiaIndonesiaIranIraqIrelandIsraelItalyJamaicaJapanJordanKazakhstanKenyaKoreaKuwaitLaosLatin AmericaLatviaLebanonLiberiaLithuaniaMalaysiaMexicoMicronesiaMiddle AfricaMoldovaMoroccoNepalNetherlandsNicaraguaNigeriaNorth AmericaNorth MacedoniaNorthern AfricaNorthern EuropeNorwayOceaniaPakistanPanamaPeruPhilippinesPolandPortugalRomaniaRussiaSaudi ArabiaScotlandSenegalSerbiaSierra LeoneSingaporeSomaliaSouth AfricaSouth AmericaSouth Central AsiaSouth Eastern AsiaSouthern EuropeSpainSri LankaSt. Vincent and the GrenadinesSudanSwedenSwitzerlandSyriaTaiwanThailandTrinidad and TobagoTurkeyUgandaUkraineUruguayUzbekistanVenezuelaVietnamWest IndiesWestern AfricaWestern AsiaWestern EuropeYemenZaireZimbabweAzores
Median Household Income
Income
Poverty
Unemployment
Labor Participation
Family Structure
Vehicle Availability
Education Level
Disability

Tongan Median Household Income
Exceptional

$93,076
HOUSEHOLD INCOME
99.4/ 100
METRIC RATING
80th/ 347
METRIC RANK

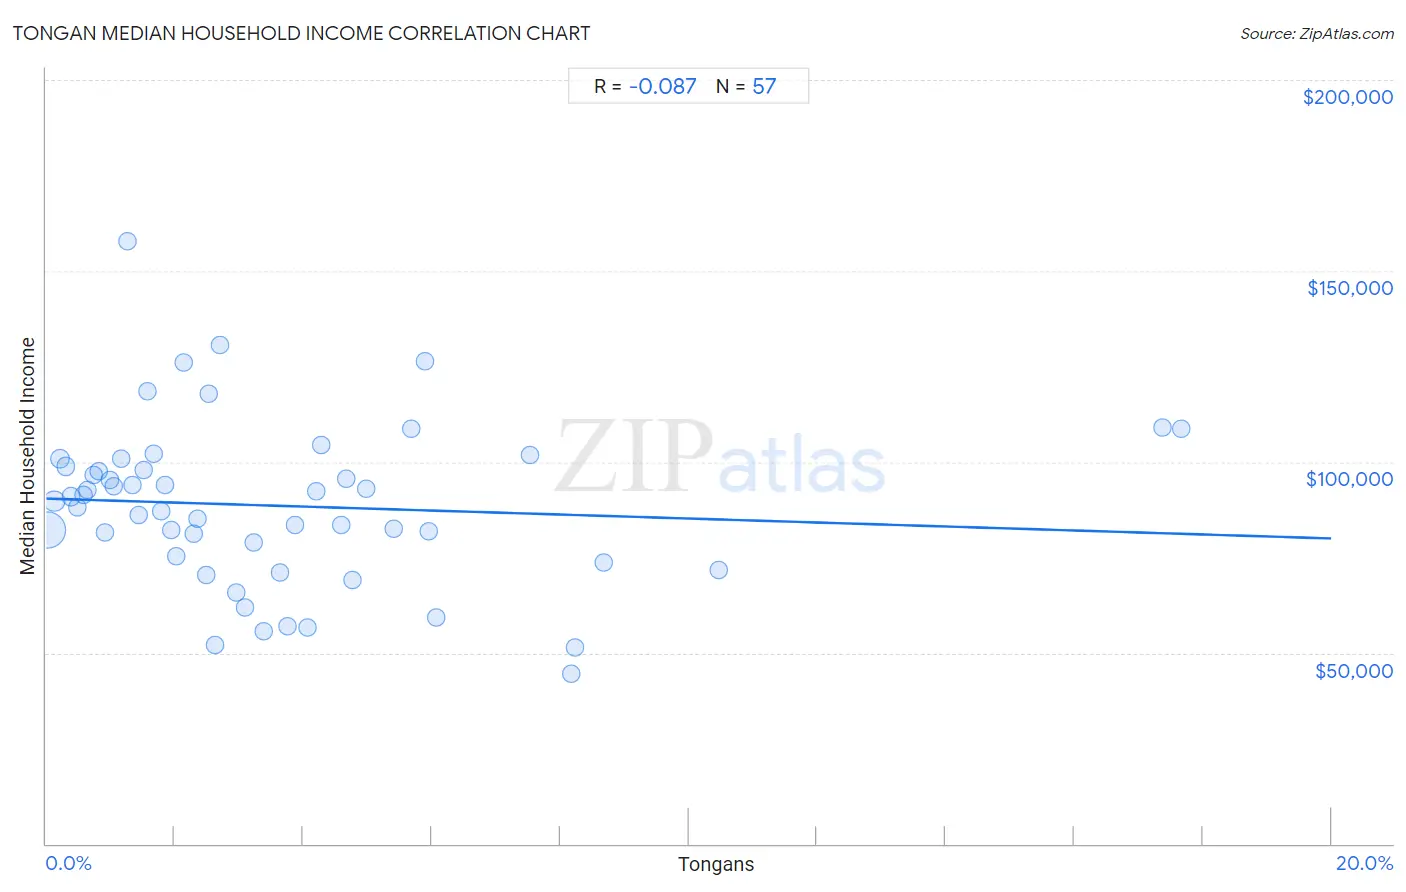
Tongan Median Household Income Correlation Chart

The statistical analysis conducted on geographies consisting of 102,857,692 people shows a slight negative correlation between the proportion of Tongans and median household income in the United States with a correlation coefficient (R) of -0.087 and weighted average of $93,076. On average, for every 1% (one percent) increase in Tongans within a typical geography, there is a decrease of $521 in median household income.
Tongan Median Household Income
It is essential to understand that the correlation between the percentage of Tongans and median household income does not imply a direct cause-and-effect relationship. It remains uncertain whether the presence of Tongans influences an upward or downward trend in the level of median household income within an area, or if Tongans simply ended up residing in those areas with higher or lower levels of median household income due to other factors.

Demographics Similar to Tongans by Median Household Income

In terms of median household income, the demographic groups most similar to Tongans are Sri Lankan ($93,093, a difference of 0.020%), Immigrants from Eastern Europe ($93,051, a difference of 0.030%), Immigrants from Bulgaria ($93,148, a difference of 0.080%), Immigrants from Afghanistan ($93,375, a difference of 0.32%), and South African ($93,379, a difference of 0.33%).
DemographicsRating | RankMedian Household Income
Immigrants from Egypt
99.6
/100
|
#73
Exceptional
$93,700
Immigrants from Latvia
99.6
/100
|
#74
Exceptional
$93,602
Immigrants from Italy
99.5
/100
|
#75
Exceptional
$93,465
South Africans
99.5
/100
|
#76
Exceptional
$93,379
Immigrants from Afghanistan
99.5
/100
|
#77
Exceptional
$93,375
Immigrants from Bulgaria
99.4
/100
|
#78
Exceptional
$93,148
Sri Lankans
99.4
/100
|
#79
Exceptional
$93,093
Tongans
99.4
/100
|
#80
Exceptional
$93,076
Immigrants from Eastern Europe
99.4
/100
|
#81
Exceptional
$93,051
Immigrants from Spain
99.3
/100
|
#82
Exceptional
$92,732
Italians
99.1
/100
|
#83
Exceptional
$92,475
Immigrants from Argentina
99.1
/100
|
#84
Exceptional
$92,417
Immigrants from Croatia
99.0
/100
|
#85
Exceptional
$92,225
Immigrants from England
98.9
/100
|
#86
Exceptional
$92,098
Immigrants from Hungary
98.9
/100
|
#87
Exceptional
$92,094

Tongan Median Household Income Correlation Summary

MeasurementTongan DataMedian Household Income Data
Minimum0.023%$44,375
Maximum17.7%$157,875
Range17.6%$113,500
Mean3.6%$88,526
Median2.5%$89,840
Interquartile 25% (IQ1)1.2%$74,550
Interquartile 75% (IQ3)4.7%$99,865
Interquartile Range (IQR)3.5%$25,315
Standard Deviation (Sample)3.6%$21,499
Standard Deviation (Population)3.6%$21,310

Correlation Details

Tongan PercentileSample SizeMedian Household Income
[
0.0%
-
0.5%
]
0.023%
74,449,087$82,033
[
0.0%
-
0.5%
]
0.13%
10,599,855$89,840
[
0.0%
-
0.5%
]
0.22%
5,186,713$100,952
[
0.0%
-
0.5%
]
0.31%
3,571,828$98,913
[
0.0%
-
0.5%
]
0.39%
1,855,234$90,878
[
0.0%
-
0.5%
]
0.48%
1,298,093$88,158
[
0.5%
-
1.0%
]
0.58%
1,279,278$91,353
[
0.5%
-
1.0%
]
0.64%
669,541$92,652
[
0.5%
-
1.0%
]
0.74%
615,604$96,444
[
0.5%
-
1.0%
]
0.82%
305,901$97,605
[
0.5%
-
1.0%
]
0.91%
241,281$81,638
[
1.0%
-
1.5%
]
1.00%
230,154$95,163
[
1.0%
-
1.5%
]
1.05%
424,787$93,576
[
1.0%
-
1.5%
]
1.16%
586,537$100,818
[
1.0%
-
1.5%
]
1.27%
88,805$157,875
[
1.0%
-
1.5%
]
1.34%
76,408$93,980
[
1.0%
-
1.5%
]
1.43%
235,690$86,000
[
1.5%
-
2.0%
]
1.53%
70,749$97,839
[
1.5%
-
2.0%
]
1.58%
99,729$118,651
[
1.5%
-
2.0%
]
1.68%
62,019$102,133
[
1.5%
-
2.0%
]
1.79%
100,730$87,133
[
1.5%
-
2.0%
]
1.84%
11,731$93,893
[
1.5%
-
2.0%
]
1.94%
18,789$82,183
[
2.0%
-
2.5%
]
2.02%
74,250$75,351
[
2.0%
-
2.5%
]
2.13%
100,992$126,014
[
2.0%
-
2.5%
]
2.29%
179,962$81,026
[
2.0%
-
2.5%
]
2.36%
48,692$85,078
[
2.0%
-
2.5%
]
2.49%
23,708$70,526
[
2.5%
-
3.0%
]
2.52%
35,392$117,678
[
2.5%
-
3.0%
]
2.62%
3,397$52,153
[
2.5%
-
3.0%
]
2.70%
56,709$130,748
[
2.5%
-
3.0%
]
2.97%
13,281$65,881
[
3.0%
-
3.5%
]
3.09%
26,954$61,841
[
3.0%
-
3.5%
]
3.24%
92,160$78,743
[
3.0%
-
3.5%
]
3.39%
295$55,750
[
3.5%
-
4.0%
]
3.63%
3,746$70,982
[
3.5%
-
4.0%
]
3.75%
853$57,000
[
3.5%
-
4.0%
]
3.86%
1,527$83,403
[
4.0%
-
4.5%
]
4.08%
6,257$56,696
[
4.0%
-
4.5%
]
4.21%
4,708$92,173
[
4.0%
-
4.5%
]
4.29%
30,983$104,494
[
4.5%
-
5.0%
]
4.59%
12,906$83,443
[
4.5%
-
5.0%
]
4.68%
4,555$95,568
[
4.5%
-
5.0%
]
4.76%
84$69,091
[
4.5%
-
5.0%
]
4.97%
23,214$92,889
[
5.0%
-
5.5%
]
5.40%
722$82,560
[
5.5%
-
6.0%
]
5.68%
3,593$108,800
[
5.5%
-
6.0%
]
5.89%
1,648$126,500
[
5.5%
-
6.0%
]
5.95%
3,986$81,836
[
6.0%
-
6.5%
]
6.06%
693$59,250
[
7.5%
-
8.0%
]
7.54%
6,779$101,939
[
8.0%
-
8.5%
]
8.16%
392$44,375
[
8.0%
-
8.5%
]
8.24%
510$51,250
[
8.5%
-
9.0%
]
8.68%
2,742$73,750
[
10.0%
-
10.5%
]
10.47%
2,274$71,758
[
17.0%
-
17.5%
]
17.37%
5,411$108,965
[
17.5%
-
18.0%
]
17.67%
5,774$108,750