Sudanese 3 or more Vehicles in Household
COMPARE
Sudanese
Select to Compare
3 or more Vehicles in Household
Sudanese 3 or more Vehicles in Household
17.8%
3+ VEHICLES AVAILABLE
1.1/ 100
METRIC RATING
258th/ 347
METRIC RANK
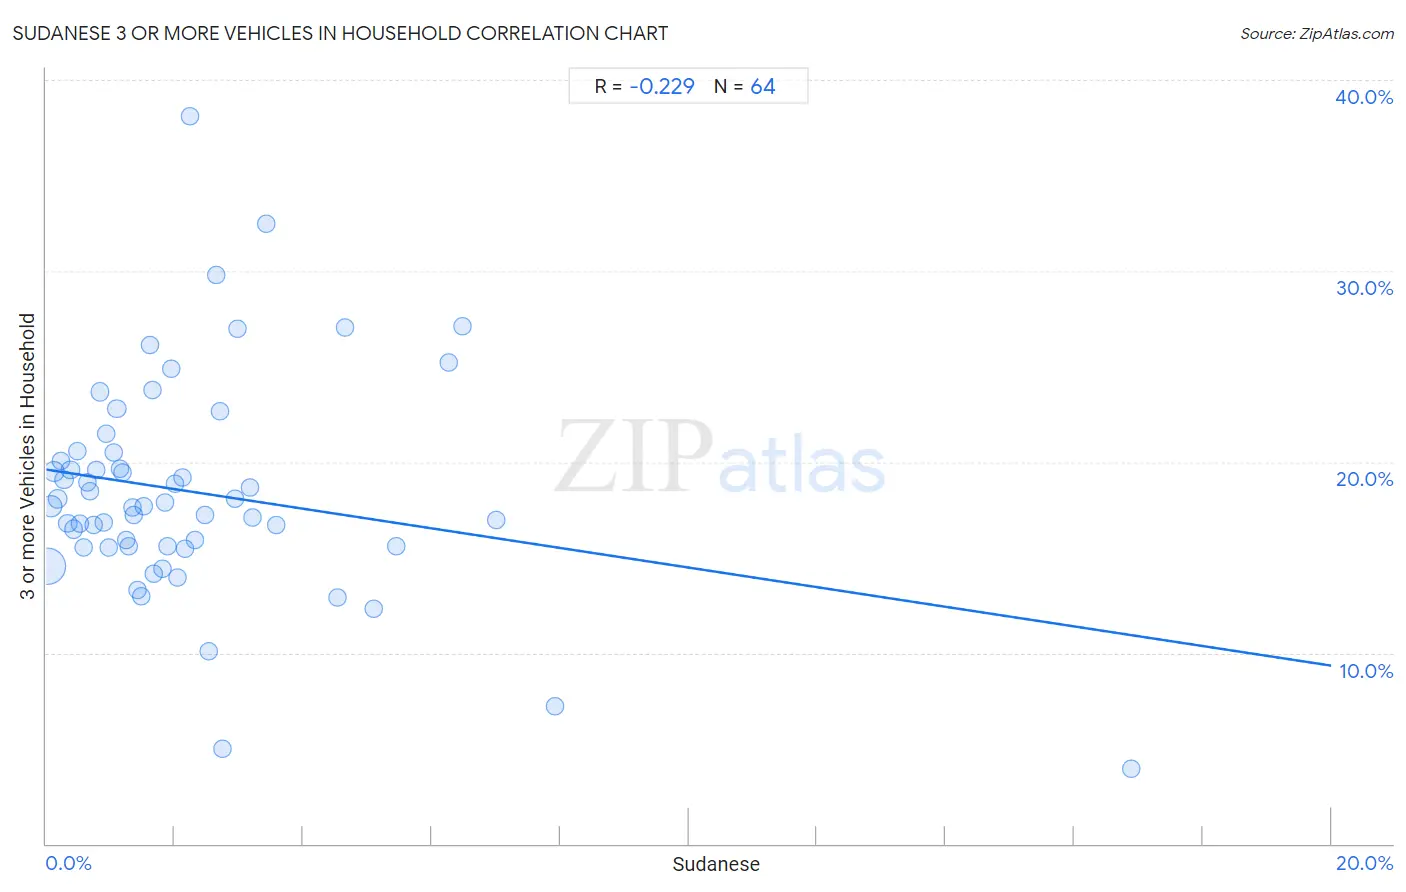
Sudanese 3 or more Vehicles in Household Correlation Chart
The statistical analysis conducted on geographies consisting of 110,082,640 people shows a weak negative correlation between the proportion of Sudanese and percentage of households with 3 or more vehicles available in the United States with a correlation coefficient (R) of -0.229 and weighted average of 17.8%. On average, for every 1% (one percent) increase in Sudanese within a typical geography, there is a decrease of 0.51% in percentage of households with 3 or more vehicles available.
It is essential to understand that the correlation between the percentage of Sudanese and percentage of households with 3 or more vehicles available does not imply a direct cause-and-effect relationship. It remains uncertain whether the presence of Sudanese influences an upward or downward trend in the level of percentage of households with 3 or more vehicles available within an area, or if Sudanese simply ended up residing in those areas with higher or lower levels of percentage of households with 3 or more vehicles available due to other factors.
Demographics Similar to Sudanese by 3 or more Vehicles in Household
In terms of 3 or more vehicles in household, the demographic groups most similar to Sudanese are Immigrants from Eritrea (17.8%, a difference of 0.0%), Subsaharan African (17.9%, a difference of 0.050%), Immigrants from Turkey (17.9%, a difference of 0.20%), Uruguayan (17.8%, a difference of 0.22%), and Immigrants from Ethiopia (17.9%, a difference of 0.23%).
| Demographics | Rating | Rank | 3 or more Vehicles in Household |
| Alsatians | 1.5 /100 | #251 | Tragic 18.0% |
| Immigrants from Southern Europe | 1.4 /100 | #252 | Tragic 17.9% |
| Immigrants from Ethiopia | 1.3 /100 | #253 | Tragic 17.9% |
| Ethiopians | 1.2 /100 | #254 | Tragic 17.9% |
| Immigrants from Turkey | 1.2 /100 | #255 | Tragic 17.9% |
| Sub-Saharan Africans | 1.1 /100 | #256 | Tragic 17.9% |
| Immigrants from Eritrea | 1.1 /100 | #257 | Tragic 17.8% |
| Sudanese | 1.1 /100 | #258 | Tragic 17.8% |
| Uruguayans | 1.0 /100 | #259 | Tragic 17.8% |
| Ugandans | 0.9 /100 | #260 | Tragic 17.8% |
| Immigrants from Northern Africa | 0.9 /100 | #261 | Tragic 17.8% |
| Colombians | 0.9 /100 | #262 | Tragic 17.8% |
| Bermudans | 0.9 /100 | #263 | Tragic 17.8% |
| Cambodians | 0.9 /100 | #264 | Tragic 17.8% |
| Immigrants from Panama | 0.8 /100 | #265 | Tragic 17.7% |
Sudanese 3 or more Vehicles in Household Correlation Summary
| Measurement | Sudanese Data | 3 or more Vehicles in Household Data |
| Minimum | 0.020% | 3.9% |
| Maximum | 16.9% | 38.1% |
| Range | 16.9% | 34.2% |
| Mean | 2.3% | 18.4% |
| Median | 1.6% | 17.7% |
| Interquartile 25% (IQ1) | 0.80% | 15.6% |
| Interquartile 75% (IQ3) | 2.7% | 20.3% |
| Interquartile Range (IQR) | 1.9% | 4.7% |
| Standard Deviation (Sample) | 2.6% | 5.7% |
| Standard Deviation (Population) | 2.5% | 5.7% |
Correlation Details
| Sudanese Percentile | Sample Size | 3 or more Vehicles in Household |
[ 0.0% - 0.5% ] 0.020% | 68,861,930 | 14.5% |
[ 0.0% - 0.5% ] 0.075% | 13,845,823 | 17.7% |
[ 0.0% - 0.5% ] 0.13% | 7,056,329 | 19.5% |
[ 0.0% - 0.5% ] 0.18% | 3,627,604 | 18.0% |
[ 0.0% - 0.5% ] 0.22% | 2,480,983 | 20.1% |
[ 0.0% - 0.5% ] 0.28% | 2,243,909 | 19.1% |
[ 0.0% - 0.5% ] 0.33% | 2,754,294 | 16.8% |
[ 0.0% - 0.5% ] 0.38% | 897,412 | 19.6% |
[ 0.0% - 0.5% ] 0.43% | 1,073,442 | 16.5% |
[ 0.0% - 0.5% ] 0.48% | 973,619 | 20.5% |
[ 0.5% - 1.0% ] 0.53% | 1,002,090 | 16.8% |
[ 0.5% - 1.0% ] 0.58% | 529,129 | 15.5% |
[ 0.5% - 1.0% ] 0.65% | 829,757 | 18.9% |
[ 0.5% - 1.0% ] 0.68% | 328,164 | 18.5% |
[ 0.5% - 1.0% ] 0.73% | 394,831 | 16.7% |
[ 0.5% - 1.0% ] 0.78% | 195,444 | 19.6% |
[ 0.5% - 1.0% ] 0.83% | 276,347 | 23.7% |
[ 0.5% - 1.0% ] 0.89% | 230,407 | 16.9% |
[ 0.5% - 1.0% ] 0.93% | 214,821 | 21.5% |
[ 0.5% - 1.0% ] 0.98% | 107,636 | 15.5% |
[ 1.0% - 1.5% ] 1.05% | 205,660 | 20.5% |
[ 1.0% - 1.5% ] 1.10% | 361,784 | 22.8% |
[ 1.0% - 1.5% ] 1.15% | 88,579 | 19.6% |
[ 1.0% - 1.5% ] 1.19% | 49,109 | 19.5% |
[ 1.0% - 1.5% ] 1.24% | 84,796 | 15.9% |
[ 1.0% - 1.5% ] 1.29% | 119,830 | 15.6% |
[ 1.0% - 1.5% ] 1.33% | 266,931 | 17.6% |
[ 1.0% - 1.5% ] 1.37% | 58,210 | 17.2% |
[ 1.0% - 1.5% ] 1.42% | 24,637 | 13.3% |
[ 1.0% - 1.5% ] 1.48% | 62,837 | 13.0% |
[ 1.5% - 2.0% ] 1.52% | 39,237 | 17.7% |
[ 1.5% - 2.0% ] 1.61% | 6,278 | 26.1% |
[ 1.5% - 2.0% ] 1.65% | 11,427 | 23.8% |
[ 1.5% - 2.0% ] 1.68% | 35,223 | 14.1% |
[ 1.5% - 2.0% ] 1.82% | 119,866 | 14.4% |
[ 1.5% - 2.0% ] 1.84% | 21,801 | 17.9% |
[ 1.5% - 2.0% ] 1.89% | 52,472 | 15.6% |
[ 1.5% - 2.0% ] 1.94% | 12,595 | 24.9% |
[ 2.0% - 2.5% ] 2.01% | 29,580 | 18.8% |
[ 2.0% - 2.5% ] 2.04% | 33,194 | 13.9% |
[ 2.0% - 2.5% ] 2.12% | 82,775 | 19.2% |
[ 2.0% - 2.5% ] 2.16% | 43,183 | 15.5% |
[ 2.0% - 2.5% ] 2.23% | 404 | 38.1% |
[ 2.0% - 2.5% ] 2.31% | 29,261 | 15.9% |
[ 2.0% - 2.5% ] 2.47% | 51,386 | 17.2% |
[ 2.5% - 3.0% ] 2.54% | 8,283 | 10.1% |
[ 2.5% - 3.0% ] 2.64% | 13,087 | 29.8% |
[ 2.5% - 3.0% ] 2.71% | 68,762 | 22.7% |
[ 2.5% - 3.0% ] 2.74% | 8,259 | 5.0% |
[ 2.5% - 3.0% ] 2.93% | 25,129 | 18.1% |
[ 2.5% - 3.0% ] 2.97% | 21,583 | 27.0% |
[ 3.0% - 3.5% ] 3.17% | 3,093 | 18.6% |
[ 3.0% - 3.5% ] 3.22% | 31,976 | 17.1% |
[ 3.0% - 3.5% ] 3.42% | 1,082 | 32.5% |
[ 3.5% - 4.0% ] 3.58% | 3,440 | 16.7% |
[ 4.5% - 5.0% ] 4.53% | 22,340 | 12.9% |
[ 4.5% - 5.0% ] 4.65% | 495 | 27.1% |
[ 5.0% - 5.5% ] 5.10% | 24,028 | 12.3% |
[ 5.0% - 5.5% ] 5.45% | 9,681 | 15.6% |
[ 6.0% - 6.5% ] 6.27% | 590 | 25.2% |
[ 6.0% - 6.5% ] 6.47% | 9,917 | 27.1% |
[ 7.0% - 7.5% ] 7.01% | 10,086 | 17.0% |
[ 7.5% - 8.0% ] 7.92% | 2,727 | 7.2% |
[ 16.5% - 17.0% ] 16.88% | 3,056 | 3.9% |