Sudanese GED/Equivalency
COMPARE
Sudanese
Select to Compare
GED/Equivalency
Sudanese GED/Equivalency
85.5%
GED/EQUIVALENCY
35.2/ 100
METRIC RATING
182nd/ 347
METRIC RANK
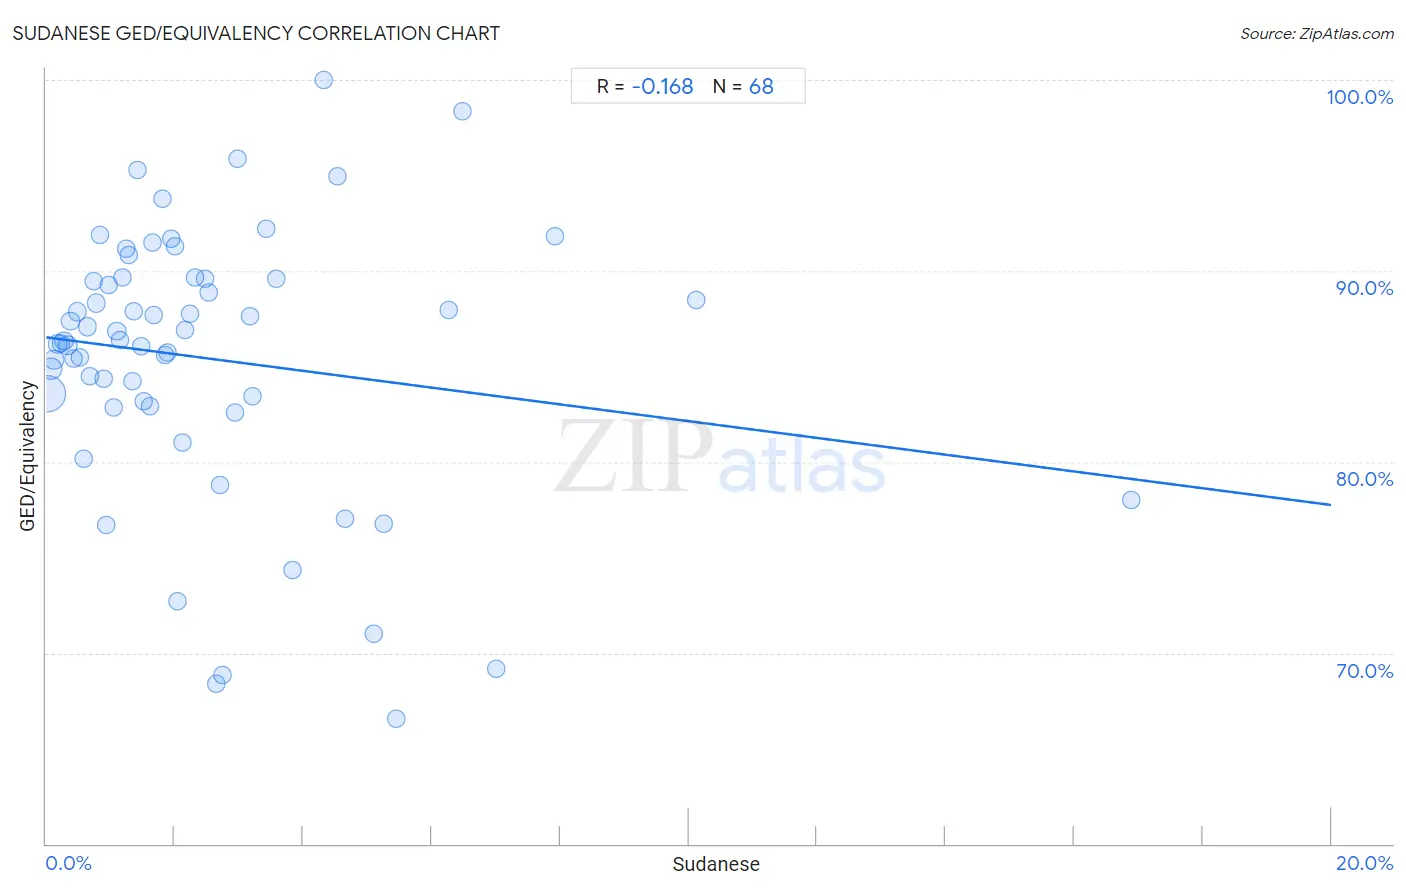
Sudanese GED/Equivalency Correlation Chart
The statistical analysis conducted on geographies consisting of 110,147,806 people shows a poor negative correlation between the proportion of Sudanese and percentage of population with at least ged/equivalency education in the United States with a correlation coefficient (R) of -0.168 and weighted average of 85.5%. On average, for every 1% (one percent) increase in Sudanese within a typical geography, there is a decrease of 0.44% in percentage of population with at least ged/equivalency education.
It is essential to understand that the correlation between the percentage of Sudanese and percentage of population with at least ged/equivalency education does not imply a direct cause-and-effect relationship. It remains uncertain whether the presence of Sudanese influences an upward or downward trend in the level of percentage of population with at least ged/equivalency education within an area, or if Sudanese simply ended up residing in those areas with higher or lower levels of percentage of population with at least ged/equivalency education due to other factors.
Demographics Similar to Sudanese by GED/Equivalency
In terms of ged/equivalency, the demographic groups most similar to Sudanese are Immigrants from Sudan (85.5%, a difference of 0.020%), Immigrants from Oceania (85.5%, a difference of 0.040%), Spanish (85.4%, a difference of 0.050%), Moroccan (85.5%, a difference of 0.060%), and Immigrants from Southern Europe (85.5%, a difference of 0.070%).
| Demographics | Rating | Rank | GED/Equivalency |
| Immigrants from Bolivia | 49.8 /100 | #175 | Average 85.8% |
| Immigrants from Eastern Africa | 47.7 /100 | #176 | Average 85.7% |
| Immigrants from Uganda | 45.2 /100 | #177 | Average 85.7% |
| Koreans | 41.2 /100 | #178 | Average 85.6% |
| Aleuts | 40.5 /100 | #179 | Average 85.6% |
| Immigrants from Southern Europe | 38.4 /100 | #180 | Fair 85.5% |
| Moroccans | 37.7 /100 | #181 | Fair 85.5% |
| Sudanese | 35.2 /100 | #182 | Fair 85.5% |
| Immigrants from Sudan | 34.2 /100 | #183 | Fair 85.5% |
| Immigrants from Oceania | 33.6 /100 | #184 | Fair 85.5% |
| Spanish | 32.8 /100 | #185 | Fair 85.4% |
| Spaniards | 31.9 /100 | #186 | Fair 85.4% |
| Immigrants from Afghanistan | 29.8 /100 | #187 | Fair 85.4% |
| Immigrants from Sierra Leone | 29.0 /100 | #188 | Fair 85.4% |
| Guamanians/Chamorros | 28.4 /100 | #189 | Fair 85.3% |
Sudanese GED/Equivalency Correlation Summary
| Measurement | Sudanese Data | GED/Equivalency Data |
| Minimum | 0.020% | 66.5% |
| Maximum | 16.9% | 100.0% |
| Range | 16.9% | 33.5% |
| Mean | 2.5% | 85.4% |
| Median | 1.7% | 86.4% |
| Interquartile 25% (IQ1) | 0.86% | 83.0% |
| Interquartile 75% (IQ3) | 3.1% | 89.6% |
| Interquartile Range (IQR) | 2.2% | 6.5% |
| Standard Deviation (Sample) | 2.7% | 7.0% |
| Standard Deviation (Population) | 2.7% | 7.0% |
Correlation Details
| Sudanese Percentile | Sample Size | GED/Equivalency |
[ 0.0% - 0.5% ] 0.020% | 68,861,930 | 83.6% |
[ 0.0% - 0.5% ] 0.075% | 13,846,924 | 84.9% |
[ 0.0% - 0.5% ] 0.13% | 7,063,878 | 85.4% |
[ 0.0% - 0.5% ] 0.18% | 3,642,218 | 86.2% |
[ 0.0% - 0.5% ] 0.22% | 2,485,123 | 86.2% |
[ 0.0% - 0.5% ] 0.28% | 2,246,522 | 86.3% |
[ 0.0% - 0.5% ] 0.33% | 2,758,954 | 86.1% |
[ 0.0% - 0.5% ] 0.38% | 902,675 | 87.4% |
[ 0.0% - 0.5% ] 0.43% | 1,073,442 | 85.4% |
[ 0.0% - 0.5% ] 0.48% | 973,619 | 87.9% |
[ 0.5% - 1.0% ] 0.53% | 1,002,090 | 85.5% |
[ 0.5% - 1.0% ] 0.58% | 529,129 | 80.1% |
[ 0.5% - 1.0% ] 0.65% | 829,757 | 87.1% |
[ 0.5% - 1.0% ] 0.68% | 328,164 | 84.5% |
[ 0.5% - 1.0% ] 0.73% | 394,831 | 89.4% |
[ 0.5% - 1.0% ] 0.78% | 195,444 | 88.3% |
[ 0.5% - 1.0% ] 0.83% | 292,745 | 91.9% |
[ 0.5% - 1.0% ] 0.89% | 230,407 | 84.4% |
[ 0.5% - 1.0% ] 0.93% | 214,821 | 76.7% |
[ 0.5% - 1.0% ] 0.98% | 107,636 | 89.3% |
[ 1.0% - 1.5% ] 1.05% | 205,660 | 82.8% |
[ 1.0% - 1.5% ] 1.10% | 361,784 | 86.8% |
[ 1.0% - 1.5% ] 1.15% | 88,579 | 86.4% |
[ 1.0% - 1.5% ] 1.19% | 49,109 | 89.7% |
[ 1.0% - 1.5% ] 1.24% | 84,796 | 91.1% |
[ 1.0% - 1.5% ] 1.29% | 119,830 | 90.8% |
[ 1.0% - 1.5% ] 1.33% | 266,931 | 84.2% |
[ 1.0% - 1.5% ] 1.37% | 58,210 | 87.9% |
[ 1.0% - 1.5% ] 1.42% | 24,637 | 95.3% |
[ 1.0% - 1.5% ] 1.48% | 62,837 | 86.1% |
[ 1.5% - 2.0% ] 1.52% | 39,237 | 83.2% |
[ 1.5% - 2.0% ] 1.61% | 6,278 | 82.9% |
[ 1.5% - 2.0% ] 1.65% | 11,427 | 91.5% |
[ 1.5% - 2.0% ] 1.68% | 35,223 | 87.7% |
[ 1.5% - 2.0% ] 1.82% | 119,866 | 93.8% |
[ 1.5% - 2.0% ] 1.84% | 21,801 | 85.6% |
[ 1.5% - 2.0% ] 1.89% | 52,472 | 85.7% |
[ 1.5% - 2.0% ] 1.94% | 12,595 | 91.7% |
[ 2.0% - 2.5% ] 2.01% | 29,580 | 91.3% |
[ 2.0% - 2.5% ] 2.04% | 33,194 | 72.7% |
[ 2.0% - 2.5% ] 2.12% | 84,292 | 81.0% |
[ 2.0% - 2.5% ] 2.16% | 43,183 | 86.9% |
[ 2.0% - 2.5% ] 2.23% | 404 | 87.7% |
[ 2.0% - 2.5% ] 2.31% | 29,261 | 89.6% |
[ 2.0% - 2.5% ] 2.47% | 51,386 | 89.6% |
[ 2.5% - 3.0% ] 2.54% | 8,283 | 88.9% |
[ 2.5% - 3.0% ] 2.64% | 13,087 | 68.4% |
[ 2.5% - 3.0% ] 2.71% | 68,762 | 78.8% |
[ 2.5% - 3.0% ] 2.74% | 8,259 | 68.8% |
[ 2.5% - 3.0% ] 2.93% | 26,293 | 82.6% |
[ 2.5% - 3.0% ] 2.97% | 21,583 | 95.8% |
[ 3.0% - 3.5% ] 3.17% | 3,093 | 87.6% |
[ 3.0% - 3.5% ] 3.22% | 31,976 | 83.5% |
[ 3.0% - 3.5% ] 3.42% | 1,082 | 92.2% |
[ 3.5% - 4.0% ] 3.58% | 3,440 | 89.6% |
[ 3.5% - 4.0% ] 3.84% | 1,822 | 74.3% |
[ 4.0% - 4.5% ] 4.32% | 533 | 100.0% |
[ 4.5% - 5.0% ] 4.53% | 22,340 | 95.0% |
[ 4.5% - 5.0% ] 4.65% | 495 | 77.0% |
[ 5.0% - 5.5% ] 5.10% | 24,028 | 71.0% |
[ 5.0% - 5.5% ] 5.26% | 2,586 | 76.8% |
[ 5.0% - 5.5% ] 5.45% | 9,681 | 66.5% |
[ 6.0% - 6.5% ] 6.27% | 590 | 87.9% |
[ 6.0% - 6.5% ] 6.47% | 9,917 | 98.4% |
[ 7.0% - 7.5% ] 7.01% | 10,086 | 69.1% |
[ 7.5% - 8.0% ] 7.92% | 2,727 | 91.8% |
[ 10.0% - 10.5% ] 10.12% | 1,206 | 88.5% |
[ 16.5% - 17.0% ] 16.88% | 3,056 | 78.0% |