Scotch-Irish Self-Care Disability
COMPARE
Scotch-Irish
Select to Compare
Self-Care Disability
Scotch-Irish Self-Care Disability
2.6%
SELF-CARE DISABILITY
4.1/ 100
METRIC RATING
218th/ 347
METRIC RANK
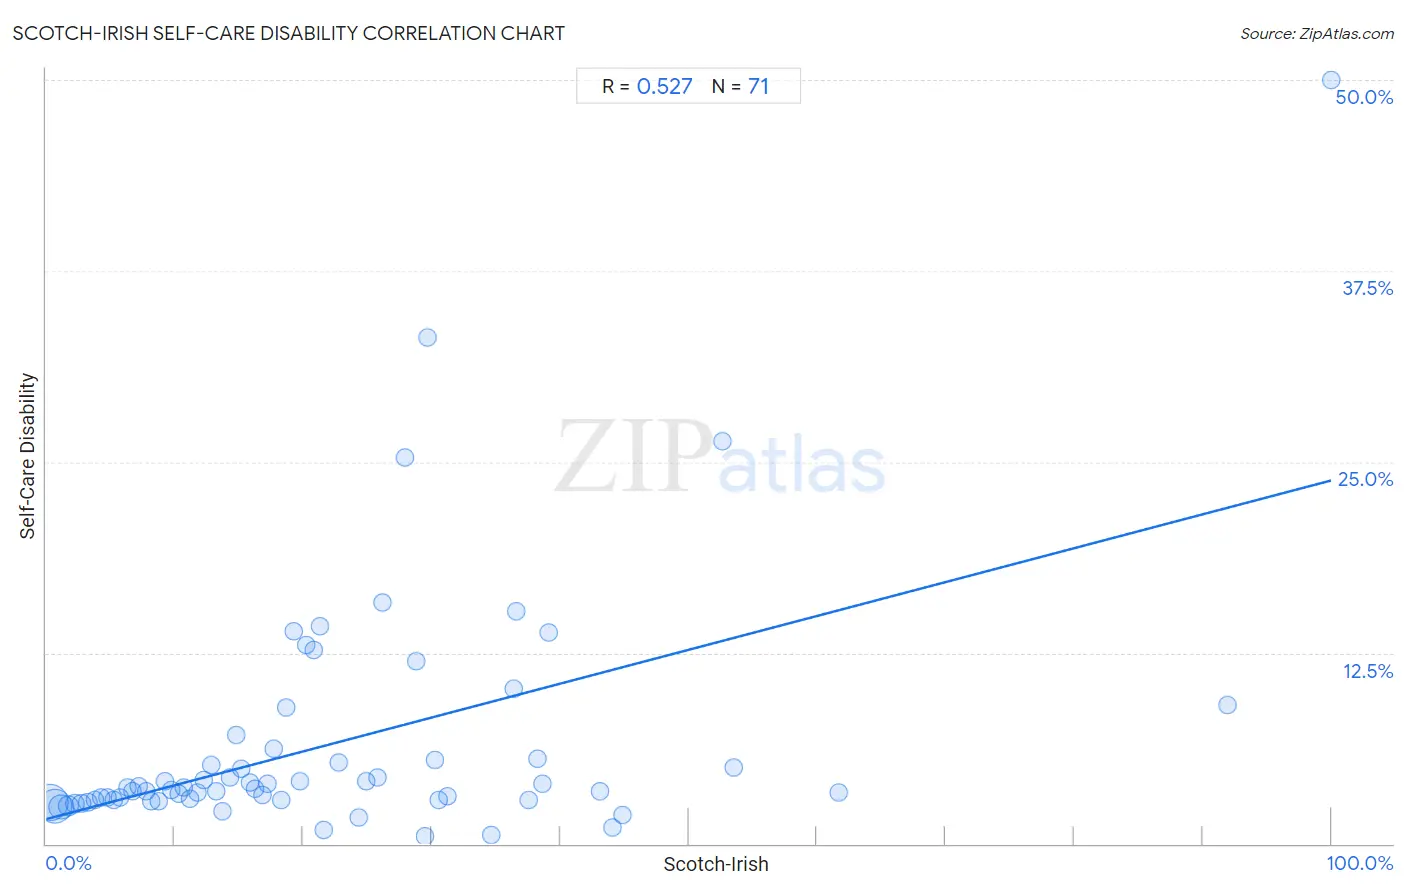
Scotch-Irish Self-Care Disability Correlation Chart
The statistical analysis conducted on geographies consisting of 547,085,910 people shows a substantial positive correlation between the proportion of Scotch-Irish and percentage of population with self-care disability in the United States with a correlation coefficient (R) of 0.527 and weighted average of 2.6%. On average, for every 1% (one percent) increase in Scotch-Irish within a typical geography, there is an increase of 0.22% in percentage of population with self-care disability.
It is essential to understand that the correlation between the percentage of Scotch-Irish and percentage of population with self-care disability does not imply a direct cause-and-effect relationship. It remains uncertain whether the presence of Scotch-Irish influences an upward or downward trend in the level of percentage of population with self-care disability within an area, or if Scotch-Irish simply ended up residing in those areas with higher or lower levels of percentage of population with self-care disability due to other factors.
Demographics Similar to Scotch-Irish by Self-Care Disability
In terms of self-care disability, the demographic groups most similar to Scotch-Irish are Immigrants from Moldova (2.6%, a difference of 0.030%), Subsaharan African (2.6%, a difference of 0.040%), Celtic (2.6%, a difference of 0.070%), Honduran (2.6%, a difference of 0.080%), and White/Caucasian (2.6%, a difference of 0.090%).
| Demographics | Rating | Rank | Self-Care Disability |
| Native Hawaiians | 5.1 /100 | #211 | Tragic 2.6% |
| Samoans | 5.1 /100 | #212 | Tragic 2.6% |
| Ecuadorians | 4.7 /100 | #213 | Tragic 2.6% |
| Immigrants from Honduras | 4.7 /100 | #214 | Tragic 2.6% |
| Immigrants from Thailand | 4.5 /100 | #215 | Tragic 2.6% |
| Whites/Caucasians | 4.4 /100 | #216 | Tragic 2.6% |
| Celtics | 4.4 /100 | #217 | Tragic 2.6% |
| Scotch-Irish | 4.1 /100 | #218 | Tragic 2.6% |
| Immigrants from Moldova | 4.0 /100 | #219 | Tragic 2.6% |
| Sub-Saharan Africans | 4.0 /100 | #220 | Tragic 2.6% |
| Hondurans | 3.8 /100 | #221 | Tragic 2.6% |
| Spaniards | 3.8 /100 | #222 | Tragic 2.6% |
| French Canadians | 3.8 /100 | #223 | Tragic 2.6% |
| Osage | 3.6 /100 | #224 | Tragic 2.6% |
| Iraqis | 3.2 /100 | #225 | Tragic 2.6% |
Scotch-Irish Self-Care Disability Correlation Summary
| Measurement | Scotch-Irish Data | Self-Care Disability Data |
| Minimum | 0.25% | 0.47% |
| Maximum | 100.0% | 50.0% |
| Range | 99.7% | 49.5% |
| Mean | 22.1% | 6.5% |
| Median | 17.7% | 3.6% |
| Interquartile 25% (IQ1) | 8.8% | 2.8% |
| Interquartile 75% (IQ3) | 30.2% | 5.6% |
| Interquartile Range (IQR) | 21.5% | 2.7% |
| Standard Deviation (Sample) | 19.0% | 8.0% |
| Standard Deviation (Population) | 18.8% | 7.9% |
Correlation Details
| Scotch-Irish Percentile | Sample Size | Self-Care Disability |
[ 0.0% - 0.5% ] 0.25% | 210,305,402 | 2.7% |
[ 0.5% - 1.0% ] 0.72% | 182,945,124 | 2.5% |
[ 1.0% - 1.5% ] 1.21% | 82,497,943 | 2.4% |
[ 1.5% - 2.0% ] 1.72% | 36,341,886 | 2.5% |
[ 2.0% - 2.5% ] 2.21% | 15,806,251 | 2.6% |
[ 2.5% - 3.0% ] 2.73% | 7,811,421 | 2.7% |
[ 3.0% - 3.5% ] 3.23% | 5,079,573 | 2.7% |
[ 3.5% - 4.0% ] 3.75% | 2,415,999 | 2.9% |
[ 4.0% - 4.5% ] 4.25% | 1,254,330 | 3.0% |
[ 4.5% - 5.0% ] 4.76% | 727,108 | 3.0% |
[ 5.0% - 5.5% ] 5.23% | 625,665 | 2.9% |
[ 5.5% - 6.0% ] 5.71% | 312,322 | 3.0% |
[ 6.0% - 6.5% ] 6.29% | 197,488 | 3.7% |
[ 6.5% - 7.0% ] 6.71% | 134,464 | 3.4% |
[ 7.0% - 7.5% ] 7.23% | 110,516 | 3.8% |
[ 7.5% - 8.0% ] 7.78% | 105,993 | 3.5% |
[ 8.0% - 8.5% ] 8.21% | 68,953 | 2.8% |
[ 8.5% - 9.0% ] 8.75% | 58,977 | 2.8% |
[ 9.0% - 9.5% ] 9.24% | 36,383 | 4.1% |
[ 9.5% - 10.0% ] 9.75% | 33,830 | 3.5% |
[ 10.0% - 10.5% ] 10.28% | 35,376 | 3.3% |
[ 10.5% - 11.0% ] 10.70% | 23,443 | 3.7% |
[ 11.0% - 11.5% ] 11.23% | 19,067 | 3.0% |
[ 11.5% - 12.0% ] 11.80% | 16,390 | 3.3% |
[ 12.0% - 12.5% ] 12.23% | 8,097 | 4.1% |
[ 12.5% - 13.0% ] 12.79% | 3,603 | 5.1% |
[ 13.0% - 13.5% ] 13.23% | 17,924 | 3.4% |
[ 13.5% - 14.0% ] 13.70% | 16,156 | 2.1% |
[ 14.0% - 14.5% ] 14.26% | 15,171 | 4.3% |
[ 14.5% - 15.0% ] 14.81% | 1,661 | 7.1% |
[ 15.0% - 15.5% ] 15.17% | 5,351 | 4.9% |
[ 15.5% - 16.0% ] 15.87% | 4,387 | 4.0% |
[ 16.0% - 16.5% ] 16.23% | 9,400 | 3.6% |
[ 16.5% - 17.0% ] 16.81% | 4,776 | 3.2% |
[ 17.0% - 17.5% ] 17.23% | 6,343 | 3.9% |
[ 17.5% - 18.0% ] 17.66% | 8,962 | 6.2% |
[ 18.0% - 18.5% ] 18.30% | 2,180 | 2.8% |
[ 18.5% - 19.0% ] 18.71% | 946 | 9.0% |
[ 19.0% - 19.5% ] 19.23% | 416 | 13.9% |
[ 19.5% - 20.0% ] 19.71% | 974 | 4.1% |
[ 20.0% - 20.5% ] 20.25% | 553 | 13.0% |
[ 20.5% - 21.0% ] 20.77% | 2,051 | 12.6% |
[ 21.0% - 21.5% ] 21.27% | 1,020 | 14.3% |
[ 21.5% - 22.0% ] 21.62% | 222 | 0.90% |
[ 22.5% - 23.0% ] 22.77% | 1,458 | 5.3% |
[ 24.0% - 24.5% ] 24.34% | 189 | 1.7% |
[ 24.5% - 25.0% ] 24.87% | 1,717 | 4.1% |
[ 25.5% - 26.0% ] 25.79% | 570 | 4.4% |
[ 26.0% - 26.5% ] 26.16% | 237 | 15.8% |
[ 27.5% - 28.0% ] 27.91% | 86 | 25.3% |
[ 28.5% - 29.0% ] 28.81% | 361 | 11.9% |
[ 29.0% - 29.5% ] 29.49% | 217 | 0.47% |
[ 29.5% - 30.0% ] 29.66% | 145 | 33.1% |
[ 30.0% - 30.5% ] 30.25% | 2,724 | 5.5% |
[ 30.5% - 31.0% ] 30.57% | 386 | 2.8% |
[ 31.0% - 31.5% ] 31.25% | 32 | 3.1% |
[ 34.5% - 35.0% ] 34.59% | 185 | 0.55% |
[ 36.0% - 36.5% ] 36.40% | 728 | 10.2% |
[ 36.5% - 37.0% ] 36.53% | 605 | 15.2% |
[ 37.5% - 38.0% ] 37.58% | 157 | 2.9% |
[ 38.0% - 38.5% ] 38.18% | 55 | 5.6% |
[ 38.5% - 39.0% ] 38.61% | 101 | 4.0% |
[ 39.0% - 39.5% ] 39.08% | 87 | 13.8% |
[ 43.0% - 43.5% ] 43.13% | 473 | 3.5% |
[ 44.0% - 44.5% ] 44.08% | 338 | 1.1% |
[ 44.5% - 45.0% ] 44.84% | 339 | 1.9% |
[ 52.5% - 53.0% ] 52.63% | 38 | 26.3% |
[ 53.5% - 54.0% ] 53.51% | 299 | 5.0% |
[ 61.5% - 62.0% ] 61.67% | 60 | 3.3% |
[ 91.5% - 92.0% ] 91.89% | 222 | 9.1% |
[ 99.5% - 100.0% ] 100.00% | 4 | 50.0% |