Ugandan Self-Care Disability

COMPARE

Ugandan
Race
Ancestry
AfghanAfricanAlaska NativeAlaskan AthabascanAlbanianAleutAlsatianAmericanApacheArabArapahoArgentineanArmenianAssyrian/Chaldean/SyriacAustralianAustrianBahamianBangladeshiBarbadianBasqueBelgianBelizeanBermudanBhutaneseBlackfeetBolivianBrazilianBritishBritish West IndianBulgarianBurmeseCajunCambodianCanadianCape VerdeanCarpatho RusynCelticCentral AmericanCentral American IndianCherokeeCheyenneChickasawChileanChineseChippewaChoctawColombianColvilleComancheCosta RicanCreeCreekCroatianCrowCubanCypriotCzechCzechoslovakianDanishDelawareDominicanDutchDutch West IndianEastern EuropeanEcuadorianEgyptianEnglishEstonianEthiopianEuropeanFijianFilipinoFinnishFrenchFrench American IndianFrench CanadianGermanGerman RussianGhanaianGreekGuamanian/ChamorroGuatemalanGuyaneseHaitianHmongHonduranHopiHoumaHungarianIcelanderIndian (Asian)IndonesianInupiatIranianIraqiIrishIroquoisIsraeliItalianJamaicanJapaneseJordanianKenyanKiowaKoreanLaotianLatvianLebaneseLiberianLithuanianLumbeeLuxembourgerMacedonianMalaysianMalteseMarshalleseMenomineeMexicanMexican American IndianMongolianMoroccanNative HawaiianNavajoNepaleseNew ZealanderNicaraguanNigerianNorthern EuropeanNorwegianOkinawanOsageOttawaPaiutePakistaniPalestinianPanamanianParaguayanPennsylvania GermanPeruvianPimaPolishPortuguesePotawatomiPuebloPuerto RicanPuget Sound SalishRomanianRussianSalvadoranSamoanScandinavianScotch-IrishScottishSeminoleSenegaleseSerbianShoshoneSierra LeoneanSiouxSlavicSlovakSloveneSomaliSouth AfricanSouth AmericanSouth American IndianSoviet UnionSpaniardSpanishSpanish AmericanSpanish American IndianSri LankanSubsaharan AfricanSudaneseSwedishSwissSyrianTaiwaneseThaiTlingit-HaidaTohono O'OdhamTonganTrinidadian and TobagonianTsimshianTurkishU.S. Virgin IslanderUgandanUkrainianUruguayanUteVenezuelanVietnameseWelshWest IndianYakamaYaquiYugoslavianYumanYup'ikZimbabwean
Immigration
NonimmigrantsImmigrantsAfghanistanAfricaAlbaniaArgentinaArmeniaAsiaAustraliaAustriaBahamasBangladeshBarbadosBelarusBelgiumBelizeBoliviaBosnia and HerzegovinaBrazilBulgariaBurma/MyanmarCabo VerdeCambodiaCameroonCanadaCaribbeanCentral AmericaChileChinaColombiaCongoCosta RicaCroatiaCubaCzechoslovakiaDenmarkDominicaDominican RepublicEastern AfricaEastern AsiaEastern EuropeEcuadorEgyptEl SalvadorEnglandEritreaEthiopiaEuropeFijiFranceGermanyGhanaGreeceGrenadaGuatemalaGuyanaHaitiHondurasHong KongHungaryIndiaIndonesiaIranIraqIrelandIsraelItalyJamaicaJapanJordanKazakhstanKenyaKoreaKuwaitLaosLatin AmericaLatviaLebanonLiberiaLithuaniaMalaysiaMexicoMicronesiaMiddle AfricaMoldovaMoroccoNepalNetherlandsNicaraguaNigeriaNorth AmericaNorth MacedoniaNorthern AfricaNorthern EuropeNorwayOceaniaPakistanPanamaPeruPhilippinesPolandPortugalRomaniaRussiaSaudi ArabiaScotlandSenegalSerbiaSierra LeoneSingaporeSomaliaSouth AfricaSouth AmericaSouth Central AsiaSouth Eastern AsiaSouthern EuropeSpainSri LankaSt. Vincent and the GrenadinesSudanSwedenSwitzerlandSyriaTaiwanThailandTrinidad and TobagoTurkeyUgandaUkraineUruguayUzbekistanVenezuelaVietnamWest IndiesWestern AfricaWestern AsiaWestern EuropeYemenZaireZimbabweAzores
Select to Compare
Race
Ancestry
AfghanAfricanAlaska NativeAlaskan AthabascanAlbanianAleutAlsatianAmericanApacheArabArapahoArgentineanArmenianAssyrian/Chaldean/SyriacAustralianAustrianBahamianBangladeshiBarbadianBasqueBelgianBelizeanBermudanBhutaneseBlackfeetBolivianBrazilianBritishBritish West IndianBulgarianBurmeseCajunCambodianCanadianCape VerdeanCarpatho RusynCelticCentral AmericanCentral American IndianCherokeeCheyenneChickasawChileanChineseChippewaChoctawColombianColvilleComancheCosta RicanCreeCreekCroatianCrowCubanCypriotCzechCzechoslovakianDanishDelawareDominicanDutchDutch West IndianEastern EuropeanEcuadorianEgyptianEnglishEstonianEthiopianEuropeanFijianFilipinoFinnishFrenchFrench American IndianFrench CanadianGermanGerman RussianGhanaianGreekGuamanian/ChamorroGuatemalanGuyaneseHaitianHmongHonduranHopiHoumaHungarianIcelanderIndian (Asian)IndonesianInupiatIranianIraqiIrishIroquoisIsraeliItalianJamaicanJapaneseJordanianKenyanKiowaKoreanLaotianLatvianLebaneseLiberianLithuanianLumbeeLuxembourgerMacedonianMalaysianMalteseMarshalleseMenomineeMexicanMexican American IndianMongolianMoroccanNative HawaiianNavajoNepaleseNew ZealanderNicaraguanNigerianNorthern EuropeanNorwegianOkinawanOsageOttawaPaiutePakistaniPalestinianPanamanianParaguayanPennsylvania GermanPeruvianPimaPolishPortuguesePotawatomiPuebloPuerto RicanPuget Sound SalishRomanianRussianSalvadoranSamoanScandinavianScotch-IrishScottishSeminoleSenegaleseSerbianShoshoneSierra LeoneanSiouxSlavicSlovakSloveneSomaliSouth AfricanSouth AmericanSouth American IndianSoviet UnionSpaniardSpanishSpanish AmericanSpanish American IndianSri LankanSubsaharan AfricanSudaneseSwedishSwissSyrianTaiwaneseThaiTlingit-HaidaTohono O'OdhamTonganTrinidadian and TobagonianTsimshianTurkishU.S. Virgin IslanderUkrainianUruguayanUteVenezuelanVietnameseWelshWest IndianYakamaYaquiYugoslavianYumanYup'ikZimbabwean
Immigration
NonimmigrantsImmigrantsAfghanistanAfricaAlbaniaArgentinaArmeniaAsiaAustraliaAustriaBahamasBangladeshBarbadosBelarusBelgiumBelizeBoliviaBosnia and HerzegovinaBrazilBulgariaBurma/MyanmarCabo VerdeCambodiaCameroonCanadaCaribbeanCentral AmericaChileChinaColombiaCongoCosta RicaCroatiaCubaCzechoslovakiaDenmarkDominicaDominican RepublicEastern AfricaEastern AsiaEastern EuropeEcuadorEgyptEl SalvadorEnglandEritreaEthiopiaEuropeFijiFranceGermanyGhanaGreeceGrenadaGuatemalaGuyanaHaitiHondurasHong KongHungaryIndiaIndonesiaIranIraqIrelandIsraelItalyJamaicaJapanJordanKazakhstanKenyaKoreaKuwaitLaosLatin AmericaLatviaLebanonLiberiaLithuaniaMalaysiaMexicoMicronesiaMiddle AfricaMoldovaMoroccoNepalNetherlandsNicaraguaNigeriaNorth AmericaNorth MacedoniaNorthern AfricaNorthern EuropeNorwayOceaniaPakistanPanamaPeruPhilippinesPolandPortugalRomaniaRussiaSaudi ArabiaScotlandSenegalSerbiaSierra LeoneSingaporeSomaliaSouth AfricaSouth AmericaSouth Central AsiaSouth Eastern AsiaSouthern EuropeSpainSri LankaSt. Vincent and the GrenadinesSudanSwedenSwitzerlandSyriaTaiwanThailandTrinidad and TobagoTurkeyUgandaUkraineUruguayUzbekistanVenezuelaVietnamWest IndiesWestern AfricaWestern AsiaWestern EuropeYemenZaireZimbabweAzores
Self-Care Disability
Income
Poverty
Unemployment
Labor Participation
Family Structure
Vehicle Availability
Education Level
Disability

Ugandan Self-Care Disability
Exceptional

2.3%
SELF-CARE DISABILITY
98.8/ 100
METRIC RATING
81st/ 347
METRIC RANK

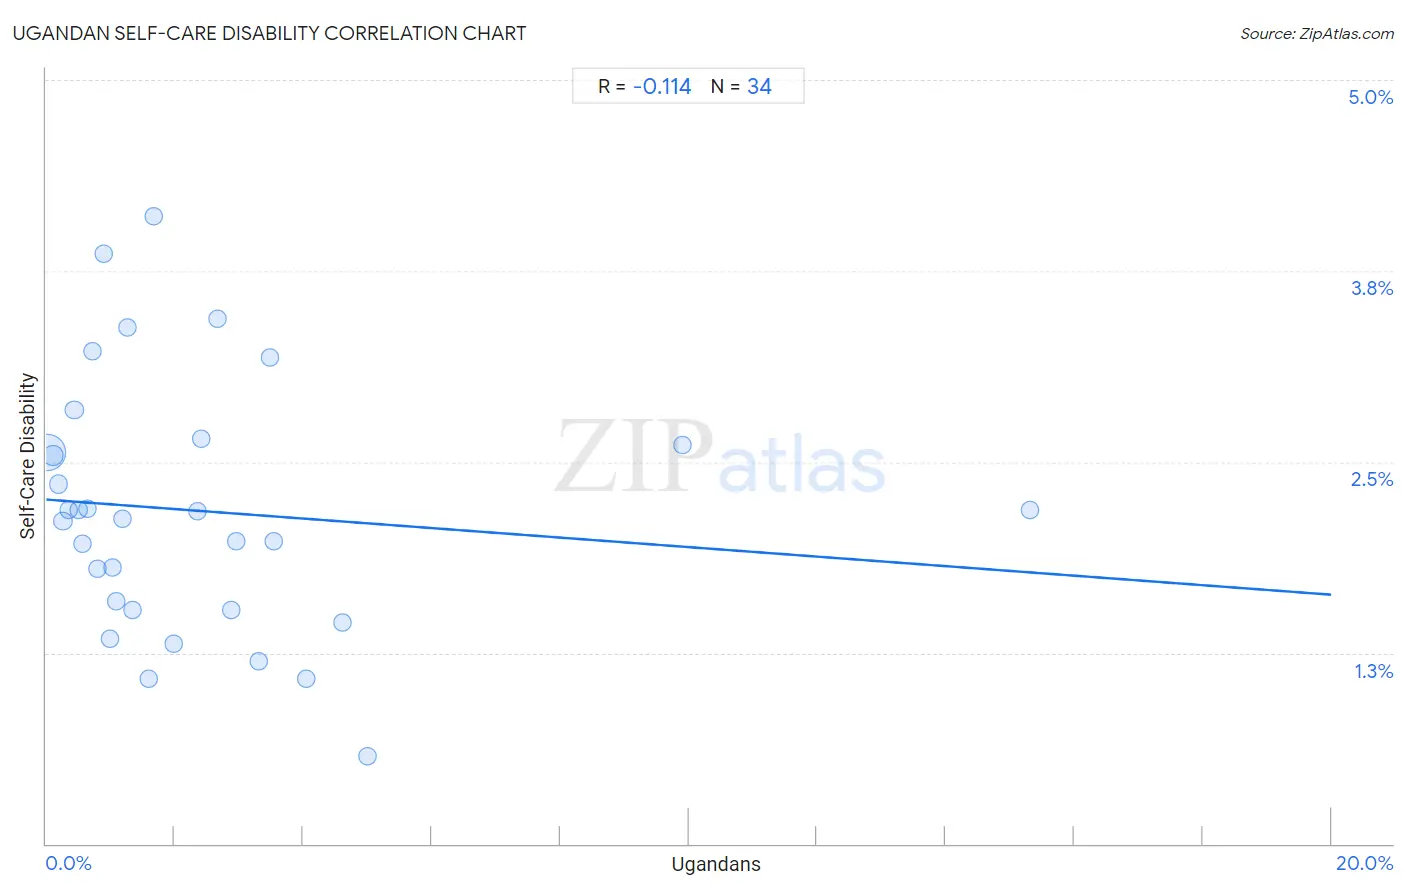
Ugandan Self-Care Disability Correlation Chart

The statistical analysis conducted on geographies consisting of 93,977,399 people shows a poor negative correlation between the proportion of Ugandans and percentage of population with self-care disability in the United States with a correlation coefficient (R) of -0.114 and weighted average of 2.3%. On average, for every 1% (one percent) increase in Ugandans within a typical geography, there is a decrease of 0.031% in percentage of population with self-care disability.
Ugandan Self-Care Disability
It is essential to understand that the correlation between the percentage of Ugandans and percentage of population with self-care disability does not imply a direct cause-and-effect relationship. It remains uncertain whether the presence of Ugandans influences an upward or downward trend in the level of percentage of population with self-care disability within an area, or if Ugandans simply ended up residing in those areas with higher or lower levels of percentage of population with self-care disability due to other factors.

Demographics Similar to Ugandans by Self-Care Disability

In terms of self-care disability, the demographic groups most similar to Ugandans are Immigrants from Denmark (2.3%, a difference of 0.0%), Chilean (2.3%, a difference of 0.070%), Indian (Asian) (2.3%, a difference of 0.070%), Immigrants from Spain (2.3%, a difference of 0.11%), and Immigrants from Middle Africa (2.3%, a difference of 0.26%).
DemographicsRating | RankSelf-Care Disability
Immigrants from Switzerland
99.1
/100
|
#74
Exceptional
2.3%
Immigrants from Netherlands
99.1
/100
|
#75
Exceptional
2.3%
Immigrants from China
99.1
/100
|
#76
Exceptional
2.3%
Immigrants from Middle Africa
99.0
/100
|
#77
Exceptional
2.3%
Immigrants from Ireland
99.0
/100
|
#78
Exceptional
2.3%
Immigrants from Kenya
99.0
/100
|
#79
Exceptional
2.3%
Chileans
98.8
/100
|
#80
Exceptional
2.3%
Ugandans
98.8
/100
|
#81
Exceptional
2.3%
Immigrants from Denmark
98.8
/100
|
#82
Exceptional
2.3%
Indians (Asian)
98.7
/100
|
#83
Exceptional
2.3%
Immigrants from Spain
98.7
/100
|
#84
Exceptional
2.3%
Estonians
98.3
/100
|
#85
Exceptional
2.3%
Immigrants from Northern Africa
98.2
/100
|
#86
Exceptional
2.3%
Sierra Leoneans
98.0
/100
|
#87
Exceptional
2.4%
Lithuanians
98.0
/100
|
#88
Exceptional
2.4%

Ugandan Self-Care Disability Correlation Summary

MeasurementUgandan DataSelf-Care Disability Data
Minimum0.016%0.57%
Maximum15.3%4.1%
Range15.3%3.5%
Mean2.4%2.2%
Median1.3%2.2%
Interquartile 25% (IQ1)0.64%1.5%
Interquartile 75% (IQ3)3.0%2.6%
Interquartile Range (IQR)2.3%1.1%
Standard Deviation (Sample)3.0%0.82%
Standard Deviation (Population)3.0%0.81%

Correlation Details

Ugandan PercentileSample SizeSelf-Care Disability
[
0.0%
-
0.5%
]
0.016%
81,499,7662.6%
[
0.0%
-
0.5%
]
0.10%
6,235,6452.5%
[
0.0%
-
0.5%
]
0.19%
2,303,6592.4%
[
0.0%
-
0.5%
]
0.26%
1,398,7582.1%
[
0.0%
-
0.5%
]
0.35%
576,2112.2%
[
0.0%
-
0.5%
]
0.44%
556,0342.8%
[
0.0%
-
0.5%
]
0.50%
258,1462.2%
[
0.5%
-
1.0%
]
0.57%
194,8702.0%
[
0.5%
-
1.0%
]
0.64%
252,5962.2%
[
0.5%
-
1.0%
]
0.72%
114,4173.2%
[
0.5%
-
1.0%
]
0.79%
110,9001.8%
[
0.5%
-
1.0%
]
0.90%
39,9413.9%
[
0.5%
-
1.0%
]
0.98%
27,5191.3%
[
1.0%
-
1.5%
]
1.03%
18,1701.8%
[
1.0%
-
1.5%
]
1.10%
163,7671.6%
[
1.0%
-
1.5%
]
1.19%
44,2082.1%
[
1.0%
-
1.5%
]
1.26%
13,5163.4%
[
1.0%
-
1.5%
]
1.34%
49,0741.5%
[
1.5%
-
2.0%
]
1.60%
5,6821.1%
[
1.5%
-
2.0%
]
1.68%
2384.1%
[
1.5%
-
2.0%
]
1.99%
6041.3%
[
2.0%
-
2.5%
]
2.36%
14,2022.2%
[
2.0%
-
2.5%
]
2.42%
8,3592.6%
[
2.5%
-
3.0%
]
2.67%
1,0103.4%
[
2.5%
-
3.0%
]
2.87%
16,1451.5%
[
2.5%
-
3.0%
]
2.96%
34,5362.0%
[
3.0%
-
3.5%
]
3.30%
6,4261.2%
[
3.0%
-
3.5%
]
3.47%
2,2743.2%
[
3.5%
-
4.0%
]
3.55%
5072.0%
[
4.0%
-
4.5%
]
4.05%
1,2101.1%
[
4.5%
-
5.0%
]
4.61%
26,6841.4%
[
5.0%
-
5.5%
]
5.00%
1800.57%
[
9.5%
-
10.0%
]
9.90%
1,3032.6%
[
15.0%
-
15.5%
]
15.32%
8422.2%