Trinidadian and Tobagonian Self-Care Disability
COMPARE
Trinidadian and Tobagonian
Select to Compare
Self-Care Disability
Trinidadian and Tobagonian Self-Care Disability
2.7%
SELF-CARE DISABILITY
0.1/ 100
METRIC RATING
271st/ 347
METRIC RANK
Trinidadian and Tobagonian Self-Care Disability Correlation Chart
The statistical analysis conducted on geographies consisting of 219,630,331 people shows a mild negative correlation between the proportion of Trinidadians and Tobagonians and percentage of population with self-care disability in the United States with a correlation coefficient (R) of -0.328 and weighted average of 2.7%. On average, for every 1% (one percent) increase in Trinidadians and Tobagonians within a typical geography, there is a decrease of 0.059% in percentage of population with self-care disability.
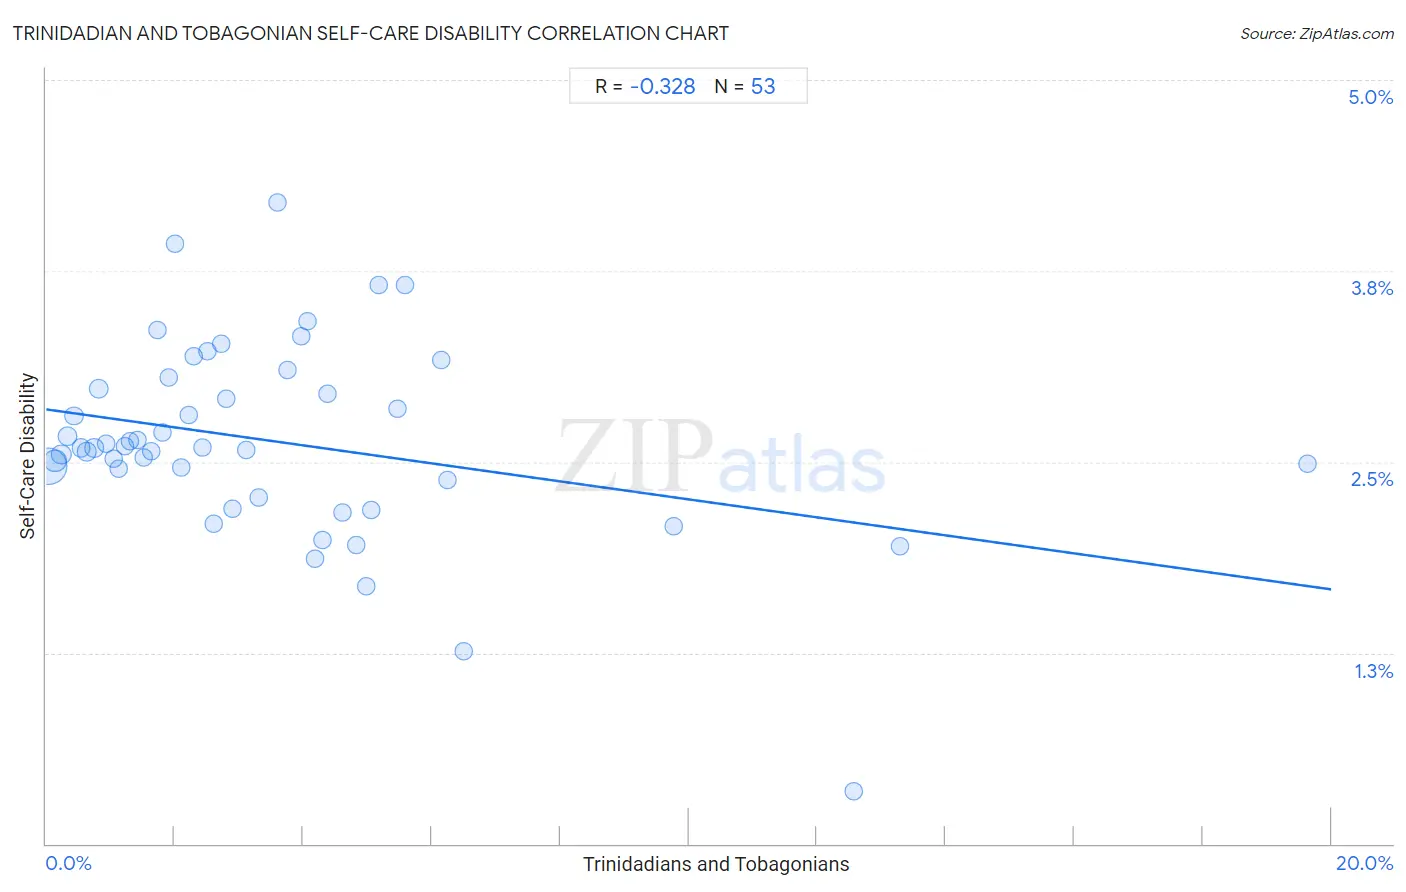
It is essential to understand that the correlation between the percentage of Trinidadians and Tobagonians and percentage of population with self-care disability does not imply a direct cause-and-effect relationship. It remains uncertain whether the presence of Trinidadians and Tobagonians influences an upward or downward trend in the level of percentage of population with self-care disability within an area, or if Trinidadians and Tobagonians simply ended up residing in those areas with higher or lower levels of percentage of population with self-care disability due to other factors.
Demographics Similar to Trinidadians and Tobagonians by Self-Care Disability
In terms of self-care disability, the demographic groups most similar to Trinidadians and Tobagonians are Immigrants from Laos (2.7%, a difference of 0.040%), Immigrants from Micronesia (2.7%, a difference of 0.060%), U.S. Virgin Islander (2.7%, a difference of 0.10%), Mexican (2.7%, a difference of 0.18%), and Yakama (2.7%, a difference of 0.24%).
| Demographics | Rating | Rank | Self-Care Disability |
| Immigrants from Iran | 0.2 /100 | #264 | Tragic 2.7% |
| Immigrants from Nicaragua | 0.2 /100 | #265 | Tragic 2.7% |
| Immigrants from Cambodia | 0.1 /100 | #266 | Tragic 2.7% |
| Yaqui | 0.1 /100 | #267 | Tragic 2.7% |
| Immigrants from Mexico | 0.1 /100 | #268 | Tragic 2.7% |
| U.S. Virgin Islanders | 0.1 /100 | #269 | Tragic 2.7% |
| Immigrants from Micronesia | 0.1 /100 | #270 | Tragic 2.7% |
| Trinidadians and Tobagonians | 0.1 /100 | #271 | Tragic 2.7% |
| Immigrants from Laos | 0.1 /100 | #272 | Tragic 2.7% |
| Mexicans | 0.1 /100 | #273 | Tragic 2.7% |
| Yakama | 0.1 /100 | #274 | Tragic 2.7% |
| Immigrants from Trinidad and Tobago | 0.1 /100 | #275 | Tragic 2.7% |
| Japanese | 0.1 /100 | #276 | Tragic 2.7% |
| Immigrants from Ukraine | 0.1 /100 | #277 | Tragic 2.7% |
| Ottawa | 0.1 /100 | #278 | Tragic 2.7% |
Trinidadian and Tobagonian Self-Care Disability Correlation Summary
| Measurement | Trinidadian and Tobagonian Data | Self-Care Disability Data |
| Minimum | 0.036% | 0.34% |
| Maximum | 19.6% | 4.2% |
| Range | 19.6% | 3.9% |
| Mean | 3.6% | 2.6% |
| Median | 2.6% | 2.6% |
| Interquartile 25% (IQ1) | 1.3% | 2.3% |
| Interquartile 75% (IQ3) | 4.7% | 3.0% |
| Interquartile Range (IQR) | 3.5% | 0.69% |
| Standard Deviation (Sample) | 3.6% | 0.64% |
| Standard Deviation (Population) | 3.5% | 0.64% |
Correlation Details
| Trinidadian and Tobagonian Percentile | Sample Size | Self-Care Disability |
[ 0.0% - 0.5% ] 0.036% | 132,782,633 | 2.5% |
[ 0.0% - 0.5% ] 0.14% | 32,275,042 | 2.5% |
[ 0.0% - 0.5% ] 0.23% | 16,426,802 | 2.5% |
[ 0.0% - 0.5% ] 0.34% | 8,729,274 | 2.7% |
[ 0.0% - 0.5% ] 0.44% | 5,110,409 | 2.8% |
[ 0.5% - 1.0% ] 0.54% | 3,237,768 | 2.6% |
[ 0.5% - 1.0% ] 0.63% | 2,419,136 | 2.6% |
[ 0.5% - 1.0% ] 0.75% | 2,123,531 | 2.6% |
[ 0.5% - 1.0% ] 0.82% | 9,470,194 | 3.0% |
[ 0.5% - 1.0% ] 0.93% | 864,867 | 2.6% |
[ 1.0% - 1.5% ] 1.05% | 699,807 | 2.5% |
[ 1.0% - 1.5% ] 1.13% | 879,812 | 2.5% |
[ 1.0% - 1.5% ] 1.23% | 845,562 | 2.6% |
[ 1.0% - 1.5% ] 1.31% | 505,216 | 2.6% |
[ 1.0% - 1.5% ] 1.43% | 530,070 | 2.6% |
[ 1.5% - 2.0% ] 1.51% | 229,441 | 2.5% |
[ 1.5% - 2.0% ] 1.63% | 209,498 | 2.6% |
[ 1.5% - 2.0% ] 1.73% | 214,264 | 3.4% |
[ 1.5% - 2.0% ] 1.82% | 220,078 | 2.7% |
[ 1.5% - 2.0% ] 1.91% | 176,402 | 3.1% |
[ 2.0% - 2.5% ] 2.01% | 113,270 | 3.9% |
[ 2.0% - 2.5% ] 2.09% | 78,239 | 2.5% |
[ 2.0% - 2.5% ] 2.21% | 48,654 | 2.8% |
[ 2.0% - 2.5% ] 2.30% | 213,898 | 3.2% |
[ 2.0% - 2.5% ] 2.43% | 119,105 | 2.6% |
[ 2.5% - 3.0% ] 2.52% | 105,641 | 3.2% |
[ 2.5% - 3.0% ] 2.61% | 18,755 | 2.1% |
[ 2.5% - 3.0% ] 2.73% | 41,983 | 3.3% |
[ 2.5% - 3.0% ] 2.81% | 26,547 | 2.9% |
[ 2.5% - 3.0% ] 2.90% | 63,904 | 2.2% |
[ 3.0% - 3.5% ] 3.12% | 1,058 | 2.6% |
[ 3.0% - 3.5% ] 3.31% | 74,741 | 2.3% |
[ 3.5% - 4.0% ] 3.61% | 8,399 | 4.2% |
[ 3.5% - 4.0% ] 3.76% | 719 | 3.1% |
[ 3.5% - 4.0% ] 3.97% | 57,192 | 3.3% |
[ 4.0% - 4.5% ] 4.07% | 87,698 | 3.4% |
[ 4.0% - 4.5% ] 4.17% | 10,495 | 1.9% |
[ 4.0% - 4.5% ] 4.30% | 7,953 | 2.0% |
[ 4.0% - 4.5% ] 4.38% | 150,569 | 2.9% |
[ 4.5% - 5.0% ] 4.62% | 101,053 | 2.2% |
[ 4.5% - 5.0% ] 4.83% | 101,329 | 2.0% |
[ 4.5% - 5.0% ] 4.98% | 51,153 | 1.7% |
[ 5.0% - 5.5% ] 5.05% | 66,262 | 2.2% |
[ 5.0% - 5.5% ] 5.17% | 6,851 | 3.7% |
[ 5.0% - 5.5% ] 5.47% | 78,506 | 2.9% |
[ 5.5% - 6.0% ] 5.57% | 2,332 | 3.7% |
[ 6.0% - 6.5% ] 6.14% | 29,820 | 3.2% |
[ 6.0% - 6.5% ] 6.24% | 2,322 | 2.4% |
[ 6.0% - 6.5% ] 6.49% | 1,510 | 1.3% |
[ 9.5% - 10.0% ] 9.77% | 1,177 | 2.1% |
[ 12.5% - 13.0% ] 12.56% | 4,179 | 0.34% |
[ 13.0% - 13.5% ] 13.29% | 2,980 | 2.0% |
[ 19.5% - 20.0% ] 19.63% | 2,231 | 2.5% |