Chickasaw Self-Care Disability
COMPARE
Chickasaw
Select to Compare
Self-Care Disability
Chickasaw Self-Care Disability
2.9%
SELF-CARE DISABILITY
0.0/ 100
METRIC RATING
320th/ 347
METRIC RANK
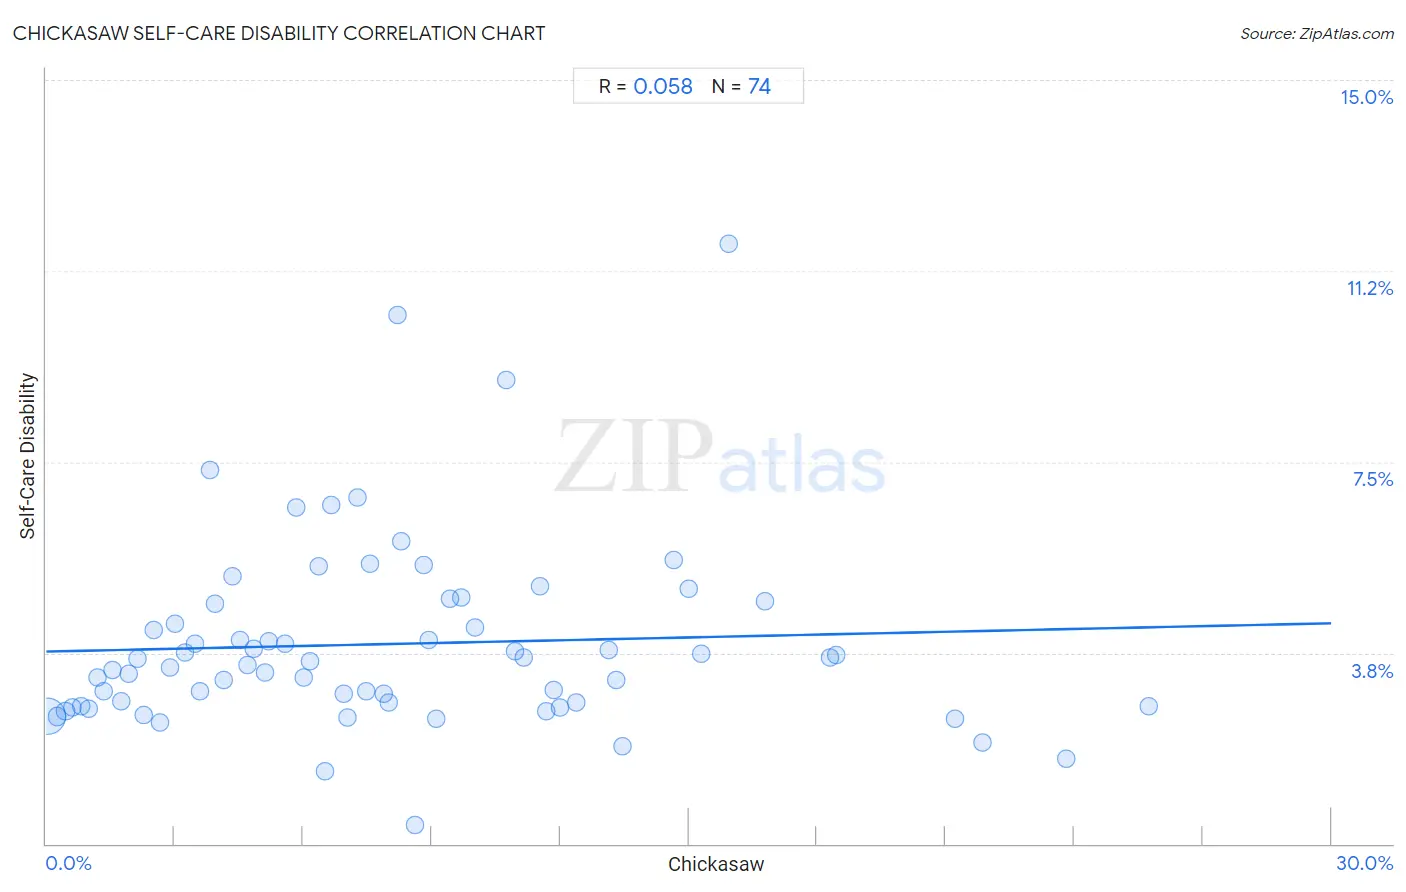
Chickasaw Self-Care Disability Correlation Chart
The statistical analysis conducted on geographies consisting of 147,605,375 people shows a slight positive correlation between the proportion of Chickasaw and percentage of population with self-care disability in the United States with a correlation coefficient (R) of 0.058 and weighted average of 2.9%. On average, for every 1% (one percent) increase in Chickasaw within a typical geography, there is an increase of 0.018% in percentage of population with self-care disability.
It is essential to understand that the correlation between the percentage of Chickasaw and percentage of population with self-care disability does not imply a direct cause-and-effect relationship. It remains uncertain whether the presence of Chickasaw influences an upward or downward trend in the level of percentage of population with self-care disability within an area, or if Chickasaw simply ended up residing in those areas with higher or lower levels of percentage of population with self-care disability due to other factors.
Demographics Similar to Chickasaw by Self-Care Disability
In terms of self-care disability, the demographic groups most similar to Chickasaw are Navajo (2.9%, a difference of 0.15%), Spanish American Indian (2.9%, a difference of 0.22%), Assyrian/Chaldean/Syriac (2.8%, a difference of 0.37%), Immigrants from Dominica (2.8%, a difference of 0.38%), and Comanche (2.9%, a difference of 0.47%).
| Demographics | Rating | Rank | Self-Care Disability |
| Spanish Americans | 0.0 /100 | #313 | Tragic 2.8% |
| Creek | 0.0 /100 | #314 | Tragic 2.8% |
| Immigrants from Cuba | 0.0 /100 | #315 | Tragic 2.8% |
| Menominee | 0.0 /100 | #316 | Tragic 2.8% |
| Immigrants from Dominica | 0.0 /100 | #317 | Tragic 2.8% |
| Assyrians/Chaldeans/Syriacs | 0.0 /100 | #318 | Tragic 2.8% |
| Spanish American Indians | 0.0 /100 | #319 | Tragic 2.9% |
| Chickasaw | 0.0 /100 | #320 | Tragic 2.9% |
| Navajo | 0.0 /100 | #321 | Tragic 2.9% |
| Comanche | 0.0 /100 | #322 | Tragic 2.9% |
| Seminole | 0.0 /100 | #323 | Tragic 2.9% |
| Cherokee | 0.0 /100 | #324 | Tragic 2.9% |
| Immigrants from Uzbekistan | 0.0 /100 | #325 | Tragic 2.9% |
| Paiute | 0.0 /100 | #326 | Tragic 2.9% |
| Blacks/African Americans | 0.0 /100 | #327 | Tragic 2.9% |
Chickasaw Self-Care Disability Correlation Summary
| Measurement | Chickasaw Data | Self-Care Disability Data |
| Minimum | 0.032% | 0.38% |
| Maximum | 25.7% | 11.8% |
| Range | 25.7% | 11.4% |
| Mean | 8.0% | 3.9% |
| Median | 7.0% | 3.5% |
| Interquartile 25% (IQ1) | 3.5% | 2.7% |
| Interquartile 75% (IQ3) | 11.5% | 4.7% |
| Interquartile Range (IQR) | 8.1% | 2.0% |
| Standard Deviation (Sample) | 5.9% | 1.9% |
| Standard Deviation (Population) | 5.9% | 1.9% |
Correlation Details
| Chickasaw Percentile | Sample Size | Self-Care Disability |
[ 0.0% - 0.5% ] 0.032% | 136,625,488 | 2.5% |
[ 0.0% - 0.5% ] 0.25% | 5,275,625 | 2.5% |
[ 0.0% - 0.5% ] 0.45% | 1,600,793 | 2.6% |
[ 0.5% - 1.0% ] 0.60% | 1,606,543 | 2.7% |
[ 0.5% - 1.0% ] 0.83% | 819,887 | 2.7% |
[ 0.5% - 1.0% ] 0.99% | 474,091 | 2.7% |
[ 1.0% - 1.5% ] 1.19% | 232,344 | 3.3% |
[ 1.0% - 1.5% ] 1.35% | 249,590 | 3.0% |
[ 1.5% - 2.0% ] 1.54% | 89,231 | 3.4% |
[ 1.5% - 2.0% ] 1.74% | 88,538 | 2.8% |
[ 1.5% - 2.0% ] 1.93% | 53,323 | 3.3% |
[ 2.0% - 2.5% ] 2.13% | 48,029 | 3.6% |
[ 2.0% - 2.5% ] 2.28% | 46,668 | 2.5% |
[ 2.5% - 3.0% ] 2.51% | 15,979 | 4.2% |
[ 2.5% - 3.0% ] 2.66% | 16,025 | 2.4% |
[ 2.5% - 3.0% ] 2.88% | 65,790 | 3.5% |
[ 3.0% - 3.5% ] 3.00% | 18,539 | 4.3% |
[ 3.0% - 3.5% ] 3.24% | 16,118 | 3.8% |
[ 3.0% - 3.5% ] 3.46% | 7,995 | 3.9% |
[ 3.5% - 4.0% ] 3.58% | 7,909 | 3.0% |
[ 3.5% - 4.0% ] 3.83% | 1,750 | 7.3% |
[ 3.5% - 4.0% ] 3.93% | 2,773 | 4.7% |
[ 4.0% - 4.5% ] 4.14% | 4,957 | 3.2% |
[ 4.0% - 4.5% ] 4.35% | 20,308 | 5.3% |
[ 4.5% - 5.0% ] 4.54% | 25,953 | 4.0% |
[ 4.5% - 5.0% ] 4.70% | 3,341 | 3.5% |
[ 4.5% - 5.0% ] 4.86% | 1,997 | 3.8% |
[ 5.0% - 5.5% ] 5.10% | 4,663 | 3.4% |
[ 5.0% - 5.5% ] 5.18% | 40,906 | 4.0% |
[ 5.5% - 6.0% ] 5.57% | 4,596 | 3.9% |
[ 5.5% - 6.0% ] 5.85% | 188 | 6.6% |
[ 5.5% - 6.0% ] 6.00% | 4,318 | 3.3% |
[ 6.0% - 6.5% ] 6.16% | 438 | 3.6% |
[ 6.0% - 6.5% ] 6.36% | 6,967 | 5.4% |
[ 6.5% - 7.0% ] 6.51% | 215 | 1.4% |
[ 6.5% - 7.0% ] 6.65% | 1,234 | 6.7% |
[ 6.5% - 7.0% ] 6.95% | 4,633 | 3.0% |
[ 7.0% - 7.5% ] 7.04% | 668 | 2.5% |
[ 7.0% - 7.5% ] 7.28% | 8,632 | 6.8% |
[ 7.0% - 7.5% ] 7.46% | 2,735 | 3.0% |
[ 7.5% - 8.0% ] 7.56% | 6,148 | 5.5% |
[ 7.5% - 8.0% ] 7.88% | 2,449 | 2.9% |
[ 8.0% - 8.5% ] 8.00% | 350 | 2.8% |
[ 8.0% - 8.5% ] 8.21% | 633 | 10.4% |
[ 8.0% - 8.5% ] 8.29% | 4,329 | 5.9% |
[ 8.5% - 9.0% ] 8.61% | 604 | 0.38% |
[ 8.5% - 9.0% ] 8.81% | 919 | 5.5% |
[ 8.5% - 9.0% ] 8.92% | 975 | 4.0% |
[ 9.0% - 9.5% ] 9.11% | 966 | 2.5% |
[ 9.0% - 9.5% ] 9.44% | 4,841 | 4.8% |
[ 9.5% - 10.0% ] 9.70% | 268 | 4.8% |
[ 10.0% - 10.5% ] 10.00% | 7,518 | 4.3% |
[ 10.5% - 11.0% ] 10.75% | 930 | 9.1% |
[ 10.5% - 11.0% ] 10.95% | 5,491 | 3.8% |
[ 11.0% - 11.5% ] 11.15% | 1,283 | 3.7% |
[ 11.5% - 12.0% ] 11.54% | 208 | 5.1% |
[ 11.5% - 12.0% ] 11.68% | 1,516 | 2.6% |
[ 11.5% - 12.0% ] 11.85% | 16,537 | 3.0% |
[ 11.5% - 12.0% ] 11.98% | 31,368 | 2.7% |
[ 12.0% - 12.5% ] 12.37% | 897 | 2.8% |
[ 13.0% - 13.5% ] 13.13% | 8,460 | 3.8% |
[ 13.0% - 13.5% ] 13.31% | 3,110 | 3.2% |
[ 13.0% - 13.5% ] 13.45% | 119 | 1.9% |
[ 14.5% - 15.0% ] 14.64% | 560 | 5.6% |
[ 15.0% - 15.5% ] 15.00% | 40 | 5.0% |
[ 15.0% - 15.5% ] 15.30% | 791 | 3.7% |
[ 15.5% - 16.0% ] 15.93% | 841 | 11.8% |
[ 16.5% - 17.0% ] 16.79% | 262 | 4.8% |
[ 18.0% - 18.5% ] 18.29% | 82 | 3.7% |
[ 18.0% - 18.5% ] 18.46% | 428 | 3.7% |
[ 21.0% - 21.5% ] 21.23% | 212 | 2.5% |
[ 21.5% - 22.0% ] 21.86% | 988 | 2.0% |
[ 23.5% - 24.0% ] 23.81% | 189 | 1.7% |
[ 25.5% - 26.0% ] 25.74% | 1,286 | 2.7% |