Immigrants from Norway Self-Care Disability
COMPARE
Immigrants from Norway
Select to Compare
Self-Care Disability
Immigrants from Norway Self-Care Disability
2.3%
SELF-CARE DISABILITY
99.2/ 100
METRIC RATING
69th/ 347
METRIC RANK
Immigrants from Norway Self-Care Disability Correlation Chart
The statistical analysis conducted on geographies consisting of 116,682,043 people shows no correlation between the proportion of Immigrants from Norway and percentage of population with self-care disability in the United States with a correlation coefficient (R) of 0.046 and weighted average of 2.3%. On average, for every 1% (one percent) increase in Immigrants from Norway within a typical geography, there is an increase of 0.054% in percentage of population with self-care disability.
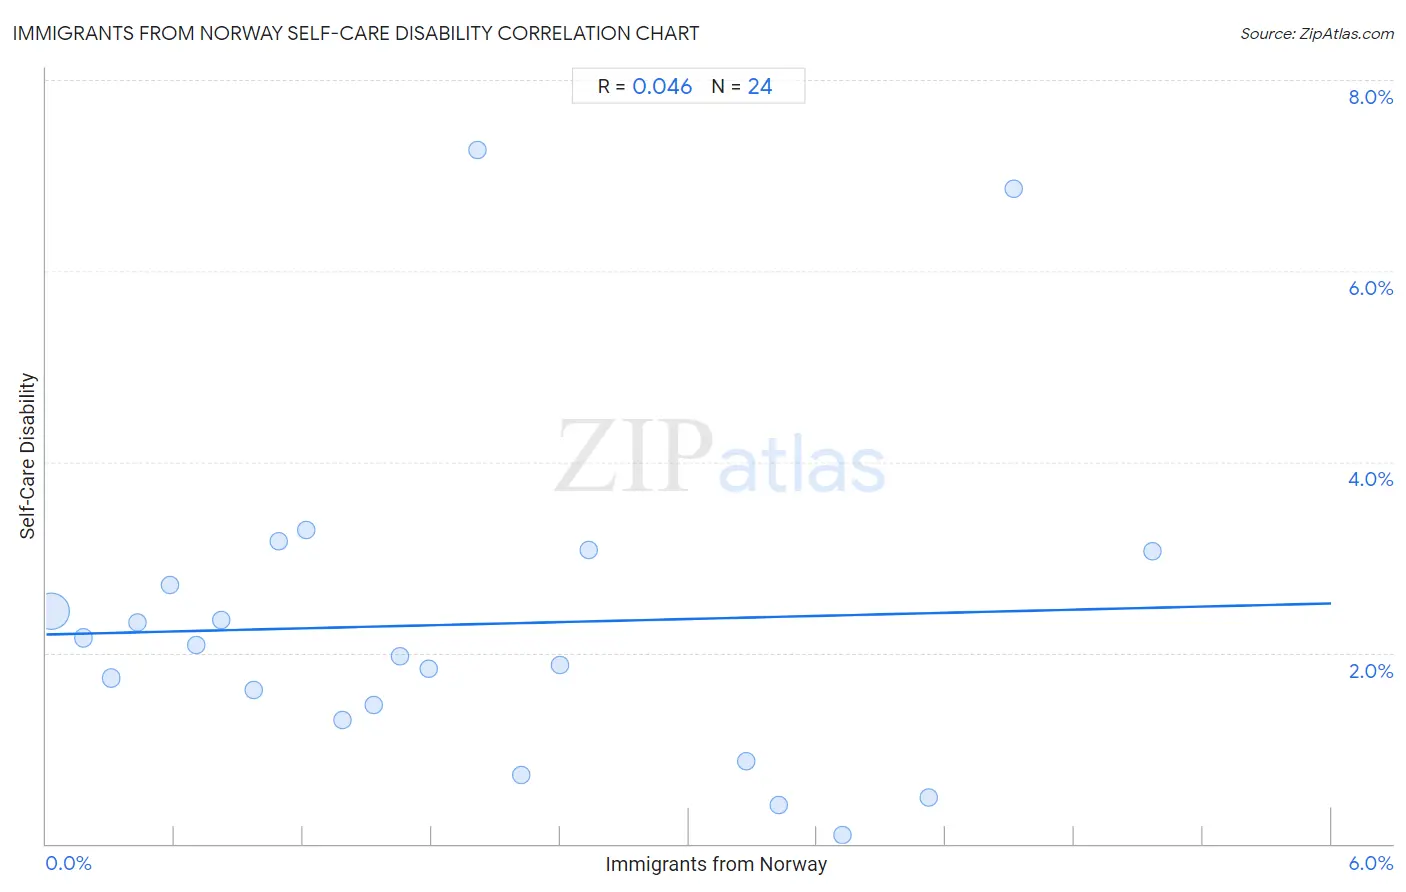
It is essential to understand that the correlation between the percentage of Immigrants from Norway and percentage of population with self-care disability does not imply a direct cause-and-effect relationship. It remains uncertain whether the presence of Immigrants from Norway influences an upward or downward trend in the level of percentage of population with self-care disability within an area, or if Immigrants from Norway simply ended up residing in those areas with higher or lower levels of percentage of population with self-care disability due to other factors.
Demographics Similar to Immigrants from Norway by Self-Care Disability
In terms of self-care disability, the demographic groups most similar to Immigrants from Norway are Immigrants from Zaire (2.3%, a difference of 0.0%), Immigrants from Northern Europe (2.3%, a difference of 0.040%), Asian (2.3%, a difference of 0.070%), South African (2.3%, a difference of 0.090%), and Eastern European (2.3%, a difference of 0.10%).
| Demographics | Rating | Rank | Self-Care Disability |
| Egyptians | 99.4 /100 | #62 | Exceptional 2.3% |
| Mongolians | 99.3 /100 | #63 | Exceptional 2.3% |
| Swedes | 99.3 /100 | #64 | Exceptional 2.3% |
| Brazilians | 99.3 /100 | #65 | Exceptional 2.3% |
| Immigrants from Argentina | 99.3 /100 | #66 | Exceptional 2.3% |
| South Africans | 99.3 /100 | #67 | Exceptional 2.3% |
| Immigrants from Zaire | 99.2 /100 | #68 | Exceptional 2.3% |
| Immigrants from Norway | 99.2 /100 | #69 | Exceptional 2.3% |
| Immigrants from Northern Europe | 99.2 /100 | #70 | Exceptional 2.3% |
| Asians | 99.2 /100 | #71 | Exceptional 2.3% |
| Eastern Europeans | 99.2 /100 | #72 | Exceptional 2.3% |
| Immigrants from Egypt | 99.1 /100 | #73 | Exceptional 2.3% |
| Immigrants from Switzerland | 99.1 /100 | #74 | Exceptional 2.3% |
| Immigrants from Netherlands | 99.1 /100 | #75 | Exceptional 2.3% |
| Immigrants from China | 99.1 /100 | #76 | Exceptional 2.3% |
Immigrants from Norway Self-Care Disability Correlation Summary
| Measurement | Immigrants from Norway Data | Self-Care Disability Data |
| Minimum | 0.022% | 0.094% |
| Maximum | 5.2% | 7.3% |
| Range | 5.1% | 7.2% |
| Mean | 1.9% | 2.3% |
| Median | 1.6% | 2.0% |
| Interquartile 25% (IQ1) | 0.76% | 1.4% |
| Interquartile 75% (IQ3) | 2.9% | 2.9% |
| Interquartile Range (IQR) | 2.1% | 1.5% |
| Standard Deviation (Sample) | 1.5% | 1.7% |
| Standard Deviation (Population) | 1.4% | 1.7% |
Correlation Details
| Immigrants from Norway Percentile | Sample Size | Self-Care Disability |
[ 0.0% - 0.5% ] 0.022% | 111,708,289 | 2.4% |
[ 0.0% - 0.5% ] 0.18% | 3,454,042 | 2.2% |
[ 0.0% - 0.5% ] 0.30% | 782,822 | 1.7% |
[ 0.0% - 0.5% ] 0.42% | 312,032 | 2.3% |
[ 0.5% - 1.0% ] 0.58% | 177,516 | 2.7% |
[ 0.5% - 1.0% ] 0.70% | 88,513 | 2.1% |
[ 0.5% - 1.0% ] 0.81% | 71,709 | 2.3% |
[ 0.5% - 1.0% ] 0.97% | 7,932 | 1.6% |
[ 1.0% - 1.5% ] 1.08% | 9,218 | 3.2% |
[ 1.0% - 1.5% ] 1.21% | 9,232 | 3.3% |
[ 1.0% - 1.5% ] 1.38% | 3,110 | 1.3% |
[ 1.5% - 2.0% ] 1.53% | 18,517 | 1.4% |
[ 1.5% - 2.0% ] 1.65% | 9,149 | 2.0% |
[ 1.5% - 2.0% ] 1.79% | 7,001 | 1.8% |
[ 2.0% - 2.5% ] 2.01% | 1,638 | 7.3% |
[ 2.0% - 2.5% ] 2.22% | 3,114 | 0.71% |
[ 2.0% - 2.5% ] 2.40% | 3,956 | 1.9% |
[ 2.5% - 3.0% ] 2.53% | 553 | 3.1% |
[ 3.0% - 3.5% ] 3.27% | 1,897 | 0.86% |
[ 3.0% - 3.5% ] 3.42% | 3,246 | 0.41% |
[ 3.5% - 4.0% ] 3.72% | 1,102 | 0.094% |
[ 4.0% - 4.5% ] 4.12% | 2,692 | 0.49% |
[ 4.5% - 5.0% ] 4.52% | 177 | 6.9% |
[ 5.0% - 5.5% ] 5.17% | 4,586 | 3.1% |