Alaskan Athabascan Self-Care Disability
COMPARE
Alaskan Athabascan
Select to Compare
Self-Care Disability
Alaskan Athabascan Self-Care Disability
2.5%
SELF-CARE DISABILITY
10.4/ 100
METRIC RATING
206th/ 347
METRIC RANK
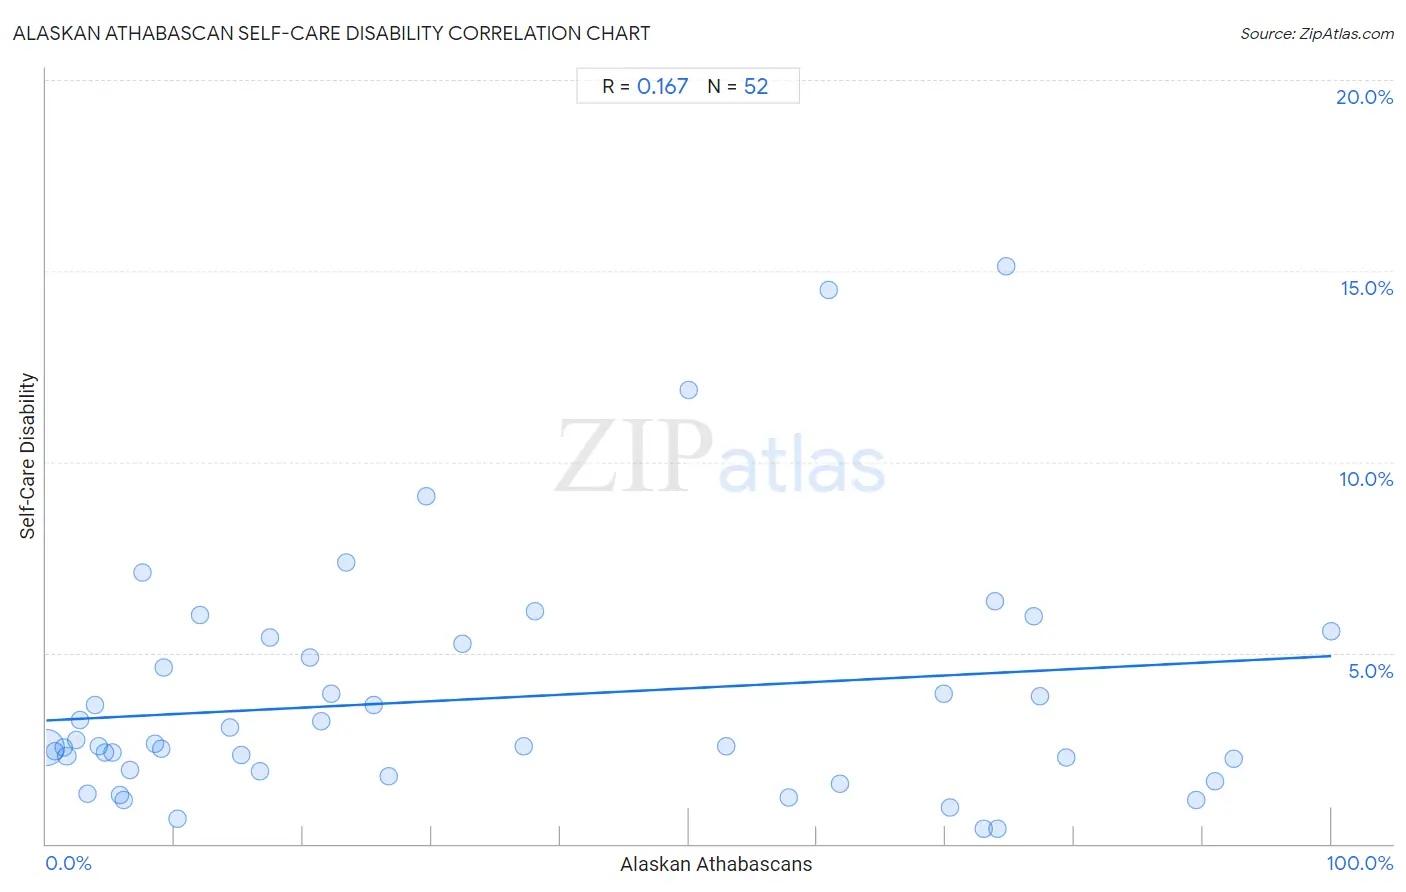
Alaskan Athabascan Self-Care Disability Correlation Chart
The statistical analysis conducted on geographies consisting of 45,796,895 people shows a poor positive correlation between the proportion of Alaskan Athabascans and percentage of population with self-care disability in the United States with a correlation coefficient (R) of 0.167 and weighted average of 2.5%. On average, for every 1% (one percent) increase in Alaskan Athabascans within a typical geography, there is an increase of 0.017% in percentage of population with self-care disability.
It is essential to understand that the correlation between the percentage of Alaskan Athabascans and percentage of population with self-care disability does not imply a direct cause-and-effect relationship. It remains uncertain whether the presence of Alaskan Athabascans influences an upward or downward trend in the level of percentage of population with self-care disability within an area, or if Alaskan Athabascans simply ended up residing in those areas with higher or lower levels of percentage of population with self-care disability due to other factors.
Demographics Similar to Alaskan Athabascans by Self-Care Disability
In terms of self-care disability, the demographic groups most similar to Alaskan Athabascans are French (2.5%, a difference of 0.060%), Immigrants from Russia (2.5%, a difference of 0.080%), Immigrants from Bahamas (2.5%, a difference of 0.18%), Central American (2.5%, a difference of 0.23%), and Immigrants from Lebanon (2.5%, a difference of 0.24%).
| Demographics | Rating | Rank | Self-Care Disability |
| Immigrants from Ghana | 14.7 /100 | #199 | Poor 2.5% |
| Immigrants from Western Africa | 13.3 /100 | #200 | Poor 2.5% |
| Immigrants from South Eastern Asia | 12.9 /100 | #201 | Poor 2.5% |
| Slovaks | 12.6 /100 | #202 | Poor 2.5% |
| Immigrants from Lebanon | 12.4 /100 | #203 | Poor 2.5% |
| Immigrants from Bahamas | 11.9 /100 | #204 | Poor 2.5% |
| Immigrants from Russia | 11.0 /100 | #205 | Poor 2.5% |
| Alaskan Athabascans | 10.4 /100 | #206 | Poor 2.5% |
| French | 9.9 /100 | #207 | Tragic 2.5% |
| Central Americans | 8.7 /100 | #208 | Tragic 2.5% |
| Malaysians | 7.7 /100 | #209 | Tragic 2.5% |
| Panamanians | 6.4 /100 | #210 | Tragic 2.5% |
| Native Hawaiians | 5.1 /100 | #211 | Tragic 2.6% |
| Samoans | 5.1 /100 | #212 | Tragic 2.6% |
| Ecuadorians | 4.7 /100 | #213 | Tragic 2.6% |
Alaskan Athabascan Self-Care Disability Correlation Summary
| Measurement | Alaskan Athabascan Data | Self-Care Disability Data |
| Minimum | 0.025% | 0.38% |
| Maximum | 100.0% | 15.1% |
| Range | 100.0% | 14.7% |
| Mean | 34.0% | 3.8% |
| Median | 21.8% | 2.6% |
| Interquartile 25% (IQ1) | 6.3% | 1.9% |
| Interquartile 75% (IQ3) | 65.8% | 5.0% |
| Interquartile Range (IQR) | 59.5% | 3.1% |
| Standard Deviation (Sample) | 31.4% | 3.2% |
| Standard Deviation (Population) | 31.1% | 3.1% |
Correlation Details
| Alaskan Athabascan Percentile | Sample Size | Self-Care Disability |
[ 0.0% - 0.5% ] 0.025% | 44,536,858 | 2.5% |
[ 0.5% - 1.0% ] 0.67% | 227,539 | 2.4% |
[ 1.0% - 1.5% ] 1.34% | 114,838 | 2.5% |
[ 1.5% - 2.0% ] 1.59% | 513,555 | 2.3% |
[ 2.0% - 2.5% ] 2.29% | 152,291 | 2.7% |
[ 2.5% - 3.0% ] 2.63% | 13,310 | 3.2% |
[ 3.0% - 3.5% ] 3.19% | 79,248 | 1.3% |
[ 3.5% - 4.0% ] 3.81% | 6,568 | 3.6% |
[ 4.0% - 4.5% ] 4.09% | 17,557 | 2.6% |
[ 4.5% - 5.0% ] 4.61% | 2,061 | 2.4% |
[ 5.0% - 5.5% ] 5.20% | 29,293 | 2.4% |
[ 5.5% - 6.0% ] 5.75% | 20,160 | 1.3% |
[ 6.0% - 6.5% ] 6.07% | 1,170 | 1.1% |
[ 6.5% - 7.0% ] 6.56% | 33,211 | 1.9% |
[ 7.5% - 8.0% ] 7.53% | 279 | 7.1% |
[ 8.0% - 8.5% ] 8.49% | 5,499 | 2.6% |
[ 8.5% - 9.0% ] 8.96% | 19,529 | 2.5% |
[ 9.0% - 9.5% ] 9.13% | 964 | 4.6% |
[ 10.0% - 10.5% ] 10.26% | 6,542 | 0.65% |
[ 11.5% - 12.0% ] 11.97% | 234 | 6.0% |
[ 14.0% - 14.5% ] 14.29% | 182 | 3.0% |
[ 15.0% - 15.5% ] 15.22% | 92 | 2.3% |
[ 16.5% - 17.0% ] 16.60% | 235 | 1.9% |
[ 17.0% - 17.5% ] 17.38% | 1,927 | 5.4% |
[ 20.5% - 21.0% ] 20.57% | 1,167 | 4.9% |
[ 21.0% - 21.5% ] 21.39% | 1,052 | 3.2% |
[ 22.0% - 22.5% ] 22.16% | 379 | 3.9% |
[ 23.0% - 23.5% ] 23.37% | 522 | 7.4% |
[ 25.0% - 25.5% ] 25.49% | 761 | 3.6% |
[ 26.5% - 27.0% ] 26.65% | 439 | 1.8% |
[ 29.5% - 30.0% ] 29.58% | 71 | 9.1% |
[ 32.0% - 32.5% ] 32.34% | 1,719 | 5.2% |
[ 37.0% - 37.5% ] 37.20% | 508 | 2.5% |
[ 38.0% - 38.5% ] 38.05% | 452 | 6.1% |
[ 50.0% - 50.5% ] 50.00% | 470 | 11.9% |
[ 52.5% - 53.0% ] 52.89% | 329 | 2.5% |
[ 57.5% - 58.0% ] 57.74% | 1,254 | 1.2% |
[ 60.5% - 61.0% ] 60.87% | 69 | 14.5% |
[ 61.5% - 62.0% ] 61.76% | 68 | 1.6% |
[ 69.5% - 70.0% ] 69.85% | 272 | 3.9% |
[ 70.0% - 70.5% ] 70.31% | 256 | 0.94% |
[ 72.5% - 73.0% ] 72.99% | 274 | 0.38% |
[ 73.5% - 74.0% ] 73.81% | 252 | 6.4% |
[ 74.0% - 74.5% ] 74.07% | 270 | 0.38% |
[ 74.5% - 75.0% ] 74.73% | 91 | 15.1% |
[ 76.5% - 77.0% ] 76.80% | 388 | 6.0% |
[ 77.0% - 77.5% ] 77.31% | 952 | 3.9% |
[ 79.0% - 79.5% ] 79.37% | 252 | 2.3% |
[ 89.5% - 90.0% ] 89.53% | 554 | 1.2% |
[ 90.5% - 91.0% ] 90.95% | 398 | 1.6% |
[ 92.0% - 92.5% ] 92.37% | 498 | 2.2% |
[ 99.5% - 100.0% ] 100.00% | 36 | 5.6% |