Jamaican Self-Care Disability
COMPARE
Jamaican
Select to Compare
Self-Care Disability
Jamaican Self-Care Disability
2.7%
SELF-CARE DISABILITY
0.0/ 100
METRIC RATING
285th/ 347
METRIC RANK
Jamaican Self-Care Disability Correlation Chart
The statistical analysis conducted on geographies consisting of 367,399,867 people shows a poor negative correlation between the proportion of Jamaicans and percentage of population with self-care disability in the United States with a correlation coefficient (R) of -0.181 and weighted average of 2.7%. On average, for every 1% (one percent) increase in Jamaicans within a typical geography, there is a decrease of 0.017% in percentage of population with self-care disability.
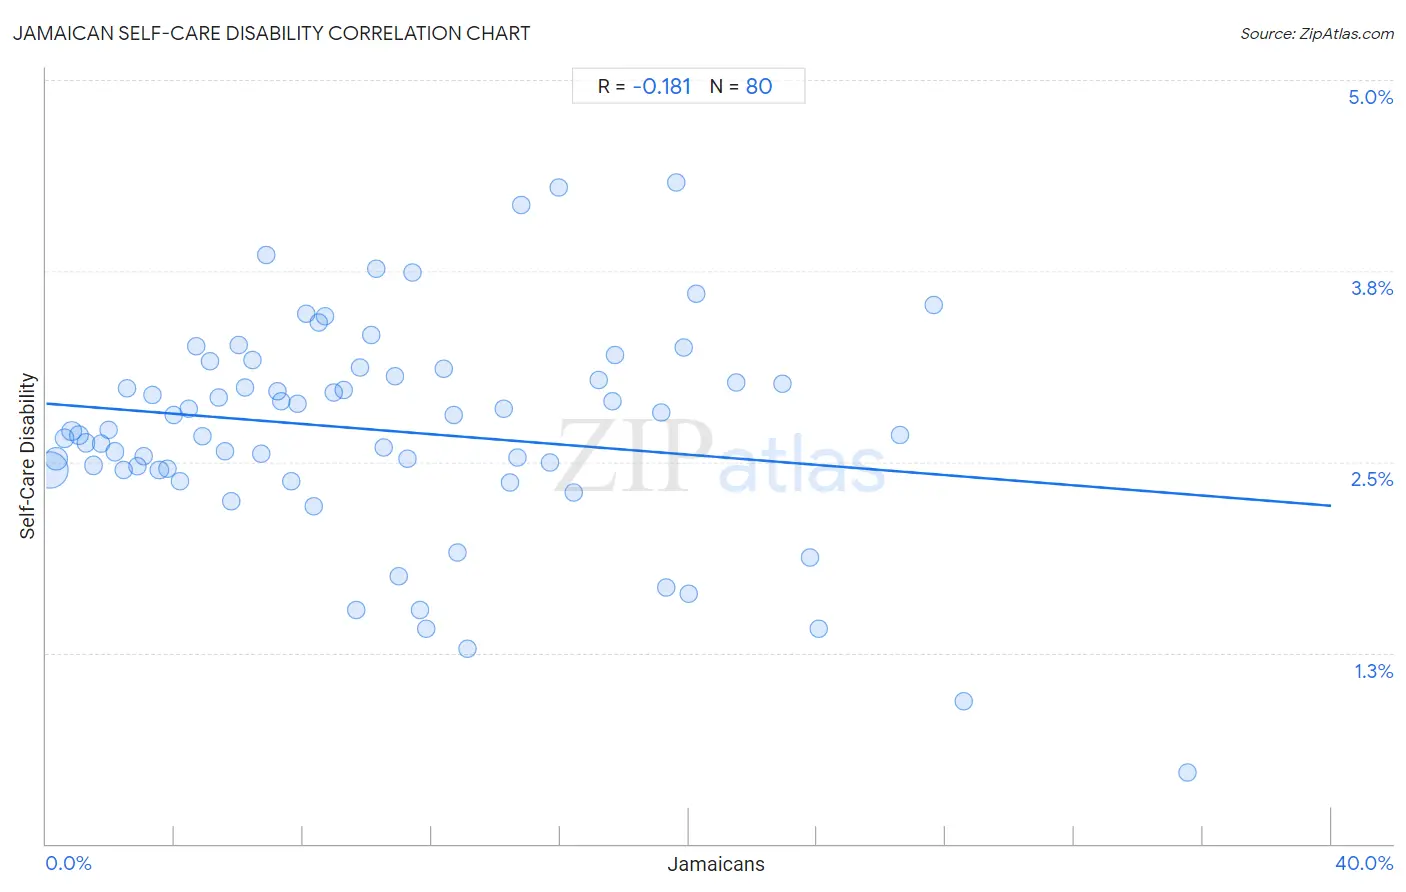
It is essential to understand that the correlation between the percentage of Jamaicans and percentage of population with self-care disability does not imply a direct cause-and-effect relationship. It remains uncertain whether the presence of Jamaicans influences an upward or downward trend in the level of percentage of population with self-care disability within an area, or if Jamaicans simply ended up residing in those areas with higher or lower levels of percentage of population with self-care disability due to other factors.
Demographics Similar to Jamaicans by Self-Care Disability
In terms of self-care disability, the demographic groups most similar to Jamaicans are Fijian (2.7%, a difference of 0.040%), Delaware (2.7%, a difference of 0.080%), Apache (2.7%, a difference of 0.16%), Immigrants from Iraq (2.7%, a difference of 0.17%), and Hispanic or Latino (2.7%, a difference of 0.33%).
| Demographics | Rating | Rank | Self-Care Disability |
| Ottawa | 0.1 /100 | #278 | Tragic 2.7% |
| Iroquois | 0.1 /100 | #279 | Tragic 2.7% |
| Hispanics or Latinos | 0.1 /100 | #280 | Tragic 2.7% |
| Immigrants from Iraq | 0.0 /100 | #281 | Tragic 2.7% |
| Apache | 0.0 /100 | #282 | Tragic 2.7% |
| Delaware | 0.0 /100 | #283 | Tragic 2.7% |
| Fijians | 0.0 /100 | #284 | Tragic 2.7% |
| Jamaicans | 0.0 /100 | #285 | Tragic 2.7% |
| French American Indians | 0.0 /100 | #286 | Tragic 2.7% |
| Immigrants from Jamaica | 0.0 /100 | #287 | Tragic 2.7% |
| Immigrants from Barbados | 0.0 /100 | #288 | Tragic 2.7% |
| Africans | 0.0 /100 | #289 | Tragic 2.7% |
| Cubans | 0.0 /100 | #290 | Tragic 2.7% |
| Guyanese | 0.0 /100 | #291 | Tragic 2.7% |
| Central American Indians | 0.0 /100 | #292 | Tragic 2.7% |
Jamaican Self-Care Disability Correlation Summary
| Measurement | Jamaican Data | Self-Care Disability Data |
| Minimum | 0.098% | 0.47% |
| Maximum | 35.5% | 4.3% |
| Range | 35.4% | 3.9% |
| Mean | 10.6% | 2.7% |
| Median | 9.1% | 2.7% |
| Interquartile 25% (IQ1) | 4.5% | 2.5% |
| Interquartile 75% (IQ3) | 15.2% | 3.1% |
| Interquartile Range (IQR) | 10.7% | 0.64% |
| Standard Deviation (Sample) | 7.7% | 0.71% |
| Standard Deviation (Population) | 7.6% | 0.70% |
Correlation Details
| Jamaican Percentile | Sample Size | Self-Care Disability |
[ 0.0% - 0.5% ] 0.098% | 212,706,786 | 2.5% |
[ 0.0% - 0.5% ] 0.32% | 56,698,292 | 2.5% |
[ 0.5% - 1.0% ] 0.57% | 24,387,293 | 2.7% |
[ 0.5% - 1.0% ] 0.79% | 17,421,042 | 2.7% |
[ 1.0% - 1.5% ] 1.02% | 10,140,194 | 2.7% |
[ 1.0% - 1.5% ] 1.24% | 6,734,932 | 2.6% |
[ 1.0% - 1.5% ] 1.46% | 5,400,250 | 2.5% |
[ 1.5% - 2.0% ] 1.71% | 3,890,904 | 2.6% |
[ 1.5% - 2.0% ] 1.93% | 3,073,751 | 2.7% |
[ 2.0% - 2.5% ] 2.15% | 2,522,016 | 2.6% |
[ 2.0% - 2.5% ] 2.40% | 1,265,051 | 2.4% |
[ 2.5% - 3.0% ] 2.52% | 10,259,008 | 3.0% |
[ 2.5% - 3.0% ] 2.85% | 899,487 | 2.5% |
[ 3.0% - 3.5% ] 3.04% | 1,386,174 | 2.5% |
[ 3.0% - 3.5% ] 3.32% | 1,262,694 | 2.9% |
[ 3.5% - 4.0% ] 3.52% | 632,497 | 2.4% |
[ 3.5% - 4.0% ] 3.77% | 665,720 | 2.5% |
[ 3.5% - 4.0% ] 3.98% | 510,062 | 2.8% |
[ 4.0% - 4.5% ] 4.16% | 340,721 | 2.4% |
[ 4.0% - 4.5% ] 4.44% | 583,467 | 2.9% |
[ 4.5% - 5.0% ] 4.65% | 539,127 | 3.3% |
[ 4.5% - 5.0% ] 4.85% | 414,141 | 2.7% |
[ 5.0% - 5.5% ] 5.10% | 152,962 | 3.2% |
[ 5.0% - 5.5% ] 5.35% | 201,661 | 2.9% |
[ 5.5% - 6.0% ] 5.56% | 311,925 | 2.6% |
[ 5.5% - 6.0% ] 5.75% | 370,061 | 2.2% |
[ 6.0% - 6.5% ] 6.00% | 358,301 | 3.3% |
[ 6.0% - 6.5% ] 6.18% | 62,675 | 3.0% |
[ 6.0% - 6.5% ] 6.43% | 183,080 | 3.2% |
[ 6.5% - 7.0% ] 6.69% | 426,536 | 2.6% |
[ 6.5% - 7.0% ] 6.86% | 156,040 | 3.9% |
[ 7.0% - 7.5% ] 7.20% | 346,080 | 3.0% |
[ 7.0% - 7.5% ] 7.33% | 140,396 | 2.9% |
[ 7.5% - 8.0% ] 7.62% | 7,365 | 2.4% |
[ 7.5% - 8.0% ] 7.80% | 162,063 | 2.9% |
[ 8.0% - 8.5% ] 8.09% | 150,471 | 3.5% |
[ 8.0% - 8.5% ] 8.33% | 138,522 | 2.2% |
[ 8.0% - 8.5% ] 8.49% | 197,052 | 3.4% |
[ 8.5% - 9.0% ] 8.69% | 100,844 | 3.5% |
[ 8.5% - 9.0% ] 8.96% | 154,467 | 3.0% |
[ 9.0% - 9.5% ] 9.25% | 40,619 | 3.0% |
[ 9.5% - 10.0% ] 9.64% | 43,733 | 1.5% |
[ 9.5% - 10.0% ] 9.78% | 139,320 | 3.1% |
[ 10.0% - 10.5% ] 10.13% | 81,392 | 3.3% |
[ 10.0% - 10.5% ] 10.28% | 63,088 | 3.8% |
[ 10.5% - 11.0% ] 10.51% | 123,924 | 2.6% |
[ 10.5% - 11.0% ] 10.84% | 38,865 | 3.1% |
[ 10.5% - 11.0% ] 10.99% | 72,684 | 1.7% |
[ 11.0% - 11.5% ] 11.24% | 94,486 | 2.5% |
[ 11.0% - 11.5% ] 11.38% | 43,517 | 3.7% |
[ 11.5% - 12.0% ] 11.64% | 739 | 1.5% |
[ 11.5% - 12.0% ] 11.84% | 135,158 | 1.4% |
[ 12.0% - 12.5% ] 12.38% | 80,527 | 3.1% |
[ 12.5% - 13.0% ] 12.70% | 14,549 | 2.8% |
[ 12.5% - 13.0% ] 12.81% | 640 | 1.9% |
[ 13.0% - 13.5% ] 13.11% | 2,555 | 1.3% |
[ 14.0% - 14.5% ] 14.23% | 78,506 | 2.9% |
[ 14.0% - 14.5% ] 14.45% | 68,431 | 2.4% |
[ 14.5% - 15.0% ] 14.65% | 13,479 | 2.5% |
[ 14.5% - 15.0% ] 14.77% | 27,845 | 4.2% |
[ 15.5% - 16.0% ] 15.69% | 1,950 | 2.5% |
[ 15.5% - 16.0% ] 15.95% | 163 | 4.3% |
[ 16.0% - 16.5% ] 16.43% | 121,912 | 2.3% |
[ 17.0% - 17.5% ] 17.21% | 22,486 | 3.0% |
[ 17.5% - 18.0% ] 17.62% | 104,158 | 2.9% |
[ 17.5% - 18.0% ] 17.71% | 72,817 | 3.2% |
[ 19.0% - 19.5% ] 19.16% | 62,232 | 2.8% |
[ 19.0% - 19.5% ] 19.31% | 47,516 | 1.7% |
[ 19.5% - 20.0% ] 19.62% | 40,073 | 4.3% |
[ 19.5% - 20.0% ] 19.85% | 72,581 | 3.2% |
[ 20.0% - 20.5% ] 20.02% | 52,792 | 1.6% |
[ 20.0% - 20.5% ] 20.24% | 40,593 | 3.6% |
[ 21.0% - 21.5% ] 21.47% | 35,914 | 3.0% |
[ 22.5% - 23.0% ] 22.90% | 118,819 | 3.0% |
[ 23.5% - 24.0% ] 23.79% | 52,000 | 1.9% |
[ 24.0% - 24.5% ] 24.06% | 10,526 | 1.4% |
[ 26.5% - 27.0% ] 26.59% | 21,977 | 2.7% |
[ 27.5% - 28.0% ] 27.61% | 326 | 3.5% |
[ 28.5% - 29.0% ] 28.55% | 641 | 0.94% |
[ 35.5% - 36.0% ] 35.52% | 2,224 | 0.47% |