Nepalese Self-Care Disability

COMPARE

Nepalese
Race
Ancestry
AfghanAfricanAlaska NativeAlaskan AthabascanAlbanianAleutAlsatianAmericanApacheArabArapahoArgentineanArmenianAssyrian/Chaldean/SyriacAustralianAustrianBahamianBangladeshiBarbadianBasqueBelgianBelizeanBermudanBhutaneseBlackfeetBolivianBrazilianBritishBritish West IndianBulgarianBurmeseCajunCambodianCanadianCape VerdeanCarpatho RusynCelticCentral AmericanCentral American IndianCherokeeCheyenneChickasawChileanChineseChippewaChoctawColombianColvilleComancheCosta RicanCreeCreekCroatianCrowCubanCypriotCzechCzechoslovakianDanishDelawareDominicanDutchDutch West IndianEastern EuropeanEcuadorianEgyptianEnglishEstonianEthiopianEuropeanFijianFilipinoFinnishFrenchFrench American IndianFrench CanadianGermanGerman RussianGhanaianGreekGuamanian/ChamorroGuatemalanGuyaneseHaitianHmongHonduranHopiHoumaHungarianIcelanderIndian (Asian)IndonesianInupiatIranianIraqiIrishIroquoisIsraeliItalianJamaicanJapaneseJordanianKenyanKiowaKoreanLaotianLatvianLebaneseLiberianLithuanianLumbeeLuxembourgerMacedonianMalaysianMalteseMarshalleseMenomineeMexicanMexican American IndianMongolianMoroccanNative HawaiianNavajoNepaleseNew ZealanderNicaraguanNigerianNorthern EuropeanNorwegianOkinawanOsageOttawaPaiutePakistaniPalestinianPanamanianParaguayanPennsylvania GermanPeruvianPimaPolishPortuguesePotawatomiPuebloPuerto RicanPuget Sound SalishRomanianRussianSalvadoranSamoanScandinavianScotch-IrishScottishSeminoleSenegaleseSerbianShoshoneSierra LeoneanSiouxSlavicSlovakSloveneSomaliSouth AfricanSouth AmericanSouth American IndianSoviet UnionSpaniardSpanishSpanish AmericanSpanish American IndianSri LankanSubsaharan AfricanSudaneseSwedishSwissSyrianTaiwaneseThaiTlingit-HaidaTohono O'OdhamTonganTrinidadian and TobagonianTsimshianTurkishU.S. Virgin IslanderUgandanUkrainianUruguayanUteVenezuelanVietnameseWelshWest IndianYakamaYaquiYugoslavianYumanYup'ikZimbabwean
Immigration
NonimmigrantsImmigrantsAfghanistanAfricaAlbaniaArgentinaArmeniaAsiaAustraliaAustriaBahamasBangladeshBarbadosBelarusBelgiumBelizeBoliviaBosnia and HerzegovinaBrazilBulgariaBurma/MyanmarCabo VerdeCambodiaCameroonCanadaCaribbeanCentral AmericaChileChinaColombiaCongoCosta RicaCroatiaCubaCzechoslovakiaDenmarkDominicaDominican RepublicEastern AfricaEastern AsiaEastern EuropeEcuadorEgyptEl SalvadorEnglandEritreaEthiopiaEuropeFijiFranceGermanyGhanaGreeceGrenadaGuatemalaGuyanaHaitiHondurasHong KongHungaryIndiaIndonesiaIranIraqIrelandIsraelItalyJamaicaJapanJordanKazakhstanKenyaKoreaKuwaitLaosLatin AmericaLatviaLebanonLiberiaLithuaniaMalaysiaMexicoMicronesiaMiddle AfricaMoldovaMoroccoNepalNetherlandsNicaraguaNigeriaNorth AmericaNorth MacedoniaNorthern AfricaNorthern EuropeNorwayOceaniaPakistanPanamaPeruPhilippinesPolandPortugalRomaniaRussiaSaudi ArabiaScotlandSenegalSerbiaSierra LeoneSingaporeSomaliaSouth AfricaSouth AmericaSouth Central AsiaSouth Eastern AsiaSouthern EuropeSpainSri LankaSt. Vincent and the GrenadinesSudanSwedenSwitzerlandSyriaTaiwanThailandTrinidad and TobagoTurkeyUgandaUkraineUruguayUzbekistanVenezuelaVietnamWest IndiesWestern AfricaWestern AsiaWestern EuropeYemenZaireZimbabweAzores
Select to Compare
Race
Ancestry
AfghanAfricanAlaska NativeAlaskan AthabascanAlbanianAleutAlsatianAmericanApacheArabArapahoArgentineanArmenianAssyrian/Chaldean/SyriacAustralianAustrianBahamianBangladeshiBarbadianBasqueBelgianBelizeanBermudanBhutaneseBlackfeetBolivianBrazilianBritishBritish West IndianBulgarianBurmeseCajunCambodianCanadianCape VerdeanCarpatho RusynCelticCentral AmericanCentral American IndianCherokeeCheyenneChickasawChileanChineseChippewaChoctawColombianColvilleComancheCosta RicanCreeCreekCroatianCrowCubanCypriotCzechCzechoslovakianDanishDelawareDominicanDutchDutch West IndianEastern EuropeanEcuadorianEgyptianEnglishEstonianEthiopianEuropeanFijianFilipinoFinnishFrenchFrench American IndianFrench CanadianGermanGerman RussianGhanaianGreekGuamanian/ChamorroGuatemalanGuyaneseHaitianHmongHonduranHopiHoumaHungarianIcelanderIndian (Asian)IndonesianInupiatIranianIraqiIrishIroquoisIsraeliItalianJamaicanJapaneseJordanianKenyanKiowaKoreanLaotianLatvianLebaneseLiberianLithuanianLumbeeLuxembourgerMacedonianMalaysianMalteseMarshalleseMenomineeMexicanMexican American IndianMongolianMoroccanNative HawaiianNavajoNew ZealanderNicaraguanNigerianNorthern EuropeanNorwegianOkinawanOsageOttawaPaiutePakistaniPalestinianPanamanianParaguayanPennsylvania GermanPeruvianPimaPolishPortuguesePotawatomiPuebloPuerto RicanPuget Sound SalishRomanianRussianSalvadoranSamoanScandinavianScotch-IrishScottishSeminoleSenegaleseSerbianShoshoneSierra LeoneanSiouxSlavicSlovakSloveneSomaliSouth AfricanSouth AmericanSouth American IndianSoviet UnionSpaniardSpanishSpanish AmericanSpanish American IndianSri LankanSubsaharan AfricanSudaneseSwedishSwissSyrianTaiwaneseThaiTlingit-HaidaTohono O'OdhamTonganTrinidadian and TobagonianTsimshianTurkishU.S. Virgin IslanderUgandanUkrainianUruguayanUteVenezuelanVietnameseWelshWest IndianYakamaYaquiYugoslavianYumanYup'ikZimbabwean
Immigration
NonimmigrantsImmigrantsAfghanistanAfricaAlbaniaArgentinaArmeniaAsiaAustraliaAustriaBahamasBangladeshBarbadosBelarusBelgiumBelizeBoliviaBosnia and HerzegovinaBrazilBulgariaBurma/MyanmarCabo VerdeCambodiaCameroonCanadaCaribbeanCentral AmericaChileChinaColombiaCongoCosta RicaCroatiaCubaCzechoslovakiaDenmarkDominicaDominican RepublicEastern AfricaEastern AsiaEastern EuropeEcuadorEgyptEl SalvadorEnglandEritreaEthiopiaEuropeFijiFranceGermanyGhanaGreeceGrenadaGuatemalaGuyanaHaitiHondurasHong KongHungaryIndiaIndonesiaIranIraqIrelandIsraelItalyJamaicaJapanJordanKazakhstanKenyaKoreaKuwaitLaosLatin AmericaLatviaLebanonLiberiaLithuaniaMalaysiaMexicoMicronesiaMiddle AfricaMoldovaMoroccoNepalNetherlandsNicaraguaNigeriaNorth AmericaNorth MacedoniaNorthern AfricaNorthern EuropeNorwayOceaniaPakistanPanamaPeruPhilippinesPolandPortugalRomaniaRussiaSaudi ArabiaScotlandSenegalSerbiaSierra LeoneSingaporeSomaliaSouth AfricaSouth AmericaSouth Central AsiaSouth Eastern AsiaSouthern EuropeSpainSri LankaSt. Vincent and the GrenadinesSudanSwedenSwitzerlandSyriaTaiwanThailandTrinidad and TobagoTurkeyUgandaUkraineUruguayUzbekistanVenezuelaVietnamWest IndiesWestern AfricaWestern AsiaWestern EuropeYemenZaireZimbabweAzores
Self-Care Disability
Income
Poverty
Unemployment
Labor Participation
Family Structure
Vehicle Availability
Education Level
Disability

Nepalese Self-Care Disability
Tragic

3.0%
SELF-CARE DISABILITY
0.0/ 100
METRIC RATING
330th/ 347
METRIC RANK

Nepalese Self-Care Disability Correlation Chart

The statistical analysis conducted on geographies consisting of 24,515,553 people shows a mild negative correlation between the proportion of Nepalese and percentage of population with self-care disability in the United States with a correlation coefficient (R) of -0.333 and weighted average of 3.0%. On average, for every 1% (one percent) increase in Nepalese within a typical geography, there is a decrease of 0.20% in percentage of population with self-care disability.
Nepalese Self-Care Disability
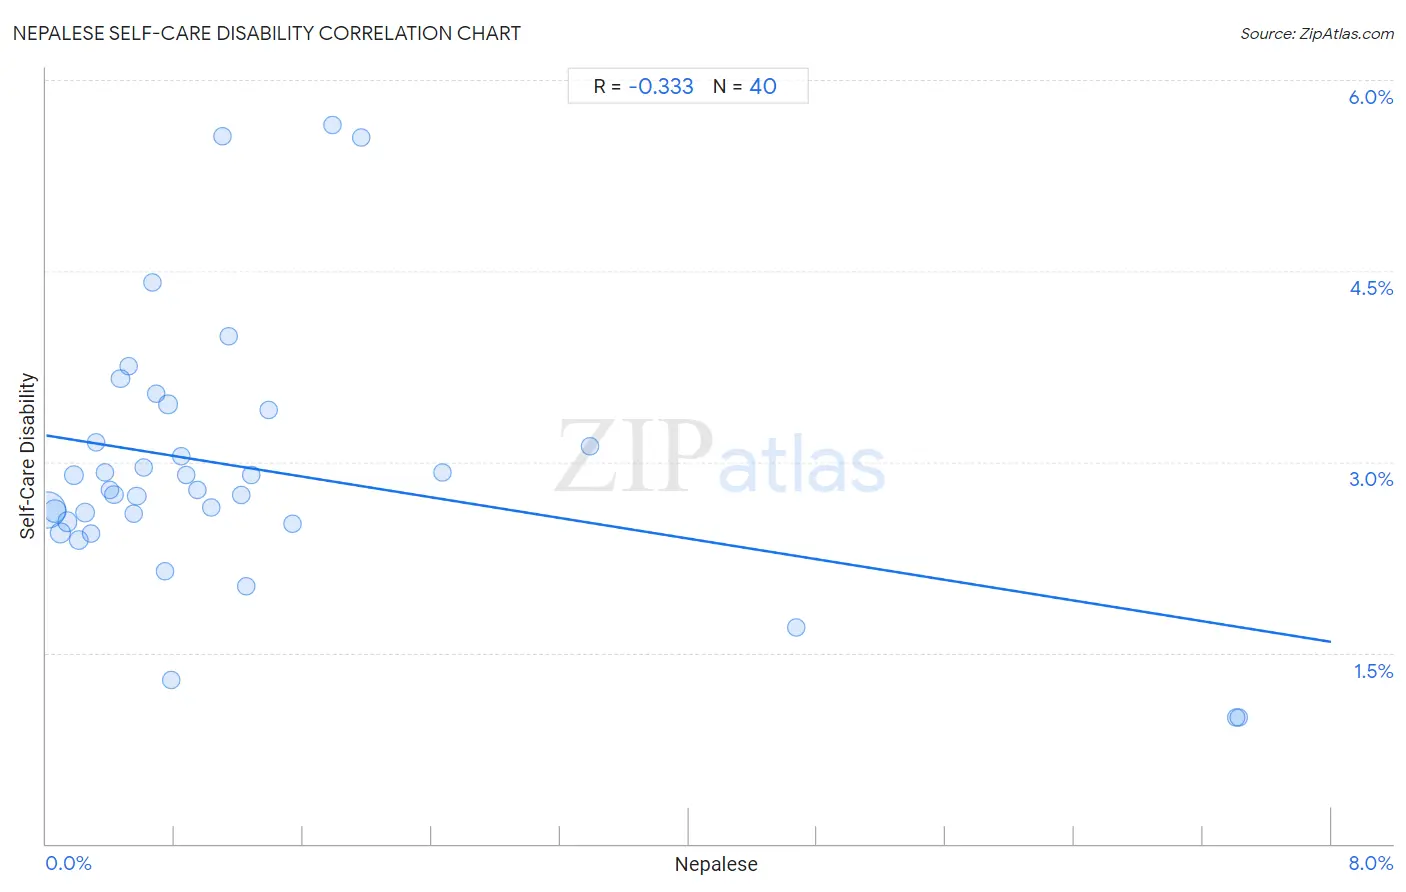
It is essential to understand that the correlation between the percentage of Nepalese and percentage of population with self-care disability does not imply a direct cause-and-effect relationship. It remains uncertain whether the presence of Nepalese influences an upward or downward trend in the level of percentage of population with self-care disability within an area, or if Nepalese simply ended up residing in those areas with higher or lower levels of percentage of population with self-care disability due to other factors.

Demographics Similar to Nepalese by Self-Care Disability

In terms of self-care disability, the demographic groups most similar to Nepalese are Lumbee (3.0%, a difference of 0.12%), Kiowa (3.0%, a difference of 0.47%), Dutch West Indian (3.0%, a difference of 0.71%), Cajun (2.9%, a difference of 0.75%), and Houma (3.0%, a difference of 0.78%).
DemographicsRating | RankSelf-Care Disability
Seminole
0.0
/100
|
#323
Tragic
2.9%
Cherokee
0.0
/100
|
#324
Tragic
2.9%
Immigrants from Uzbekistan
0.0
/100
|
#325
Tragic
2.9%
Paiute
0.0
/100
|
#326
Tragic
2.9%
Blacks/African Americans
0.0
/100
|
#327
Tragic
2.9%
Hopi
0.0
/100
|
#328
Tragic
2.9%
Cajuns
0.0
/100
|
#329
Tragic
2.9%
Nepalese
0.0
/100
|
#330
Tragic
3.0%
Lumbee
0.0
/100
|
#331
Tragic
3.0%
Kiowa
0.0
/100
|
#332
Tragic
3.0%
Dutch West Indians
0.0
/100
|
#333
Tragic
3.0%
Houma
0.0
/100
|
#334
Tragic
3.0%
Immigrants from the Azores
0.0
/100
|
#335
Tragic
3.0%
Immigrants from Yemen
0.0
/100
|
#336
Tragic
3.0%
Choctaw
0.0
/100
|
#337
Tragic
3.0%

Nepalese Self-Care Disability Correlation Summary

MeasurementNepalese DataSelf-Care Disability Data
Minimum0.0096%0.99%
Maximum7.4%5.6%
Range7.4%4.7%
Mean1.3%3.0%
Median0.75%2.8%
Interquartile 25% (IQ1)0.38%2.5%
Interquartile 75% (IQ3)1.3%3.3%
Interquartile Range (IQR)0.88%0.76%
Standard Deviation (Sample)1.7%1.0%
Standard Deviation (Population)1.7%1.0%

Correlation Details

Nepalese PercentileSample SizeSelf-Care Disability
[
0.0%
-
0.5%
]
0.0096%
13,361,7152.6%
[
0.0%
-
0.5%
]
0.054%
3,796,8072.6%
[
0.0%
-
0.5%
]
0.089%
1,243,1922.4%
[
0.0%
-
0.5%
]
0.13%
1,098,8382.5%
[
0.0%
-
0.5%
]
0.17%
641,3822.9%
[
0.0%
-
0.5%
]
0.21%
853,1682.4%
[
0.0%
-
0.5%
]
0.24%
759,5972.6%
[
0.0%
-
0.5%
]
0.28%
277,6822.4%
[
0.0%
-
0.5%
]
0.31%
230,7783.2%
[
0.0%
-
0.5%
]
0.36%
142,7822.9%
[
0.0%
-
0.5%
]
0.40%
123,2682.8%
[
0.0%
-
0.5%
]
0.42%
568,3422.7%
[
0.0%
-
0.5%
]
0.46%
197,8733.7%
[
0.5%
-
1.0%
]
0.51%
111,3593.8%
[
0.5%
-
1.0%
]
0.54%
87,4412.6%
[
0.5%
-
1.0%
]
0.56%
189,4072.7%
[
0.5%
-
1.0%
]
0.60%
38,4593.0%
[
0.5%
-
1.0%
]
0.66%
91,3594.4%
[
0.5%
-
1.0%
]
0.69%
60,8503.5%
[
0.5%
-
1.0%
]
0.74%
22,1452.1%
[
0.5%
-
1.0%
]
0.76%
114,4993.5%
[
0.5%
-
1.0%
]
0.78%
16,1501.3%
[
0.5%
-
1.0%
]
0.84%
56,6503.0%
[
0.5%
-
1.0%
]
0.87%
57,9432.9%
[
0.5%
-
1.0%
]
0.94%
118,1052.8%
[
1.0%
-
1.5%
]
1.03%
7,5812.6%
[
1.0%
-
1.5%
]
1.10%
20,8355.6%
[
1.0%
-
1.5%
]
1.13%
41,3114.0%
[
1.0%
-
1.5%
]
1.21%
5,2022.7%
[
1.0%
-
1.5%
]
1.25%
2,4862.0%
[
1.0%
-
1.5%
]
1.28%
33,1162.9%
[
1.0%
-
1.5%
]
1.38%
80,5433.4%
[
1.5%
-
2.0%
]
1.53%
10,9022.5%
[
1.5%
-
2.0%
]
1.78%
14,8245.6%
[
1.5%
-
2.0%
]
1.96%
30,5565.6%
[
2.0%
-
2.5%
]
2.47%
1,2972.9%
[
3.0%
-
3.5%
]
3.39%
3,9553.1%
[
4.5%
-
5.0%
]
4.67%
2,2911.7%
[
7.0%
-
7.5%
]
7.41%
4320.99%
[
7.0%
-
7.5%
]
7.42%
4311.00%