Delaware Self-Care Disability
COMPARE
Delaware
Select to Compare
Self-Care Disability
Delaware Self-Care Disability
2.7%
SELF-CARE DISABILITY
0.0/ 100
METRIC RATING
283rd/ 347
METRIC RANK
Delaware Self-Care Disability Correlation Chart
The statistical analysis conducted on geographies consisting of 96,205,840 people shows a weak positive correlation between the proportion of Delaware and percentage of population with self-care disability in the United States with a correlation coefficient (R) of 0.243 and weighted average of 2.7%. On average, for every 1% (one percent) increase in Delaware within a typical geography, there is an increase of 0.15% in percentage of population with self-care disability.
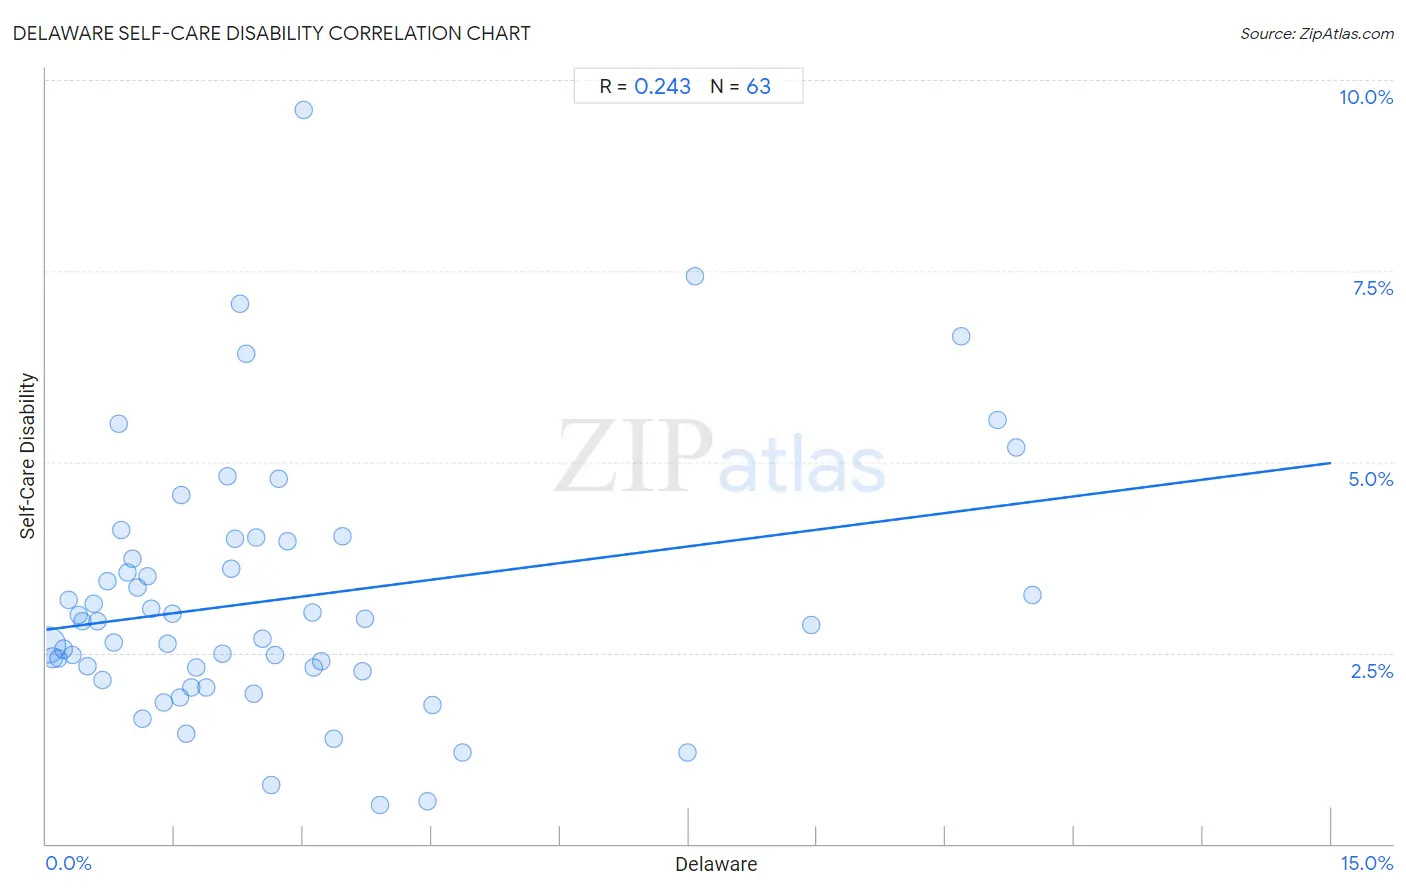
It is essential to understand that the correlation between the percentage of Delaware and percentage of population with self-care disability does not imply a direct cause-and-effect relationship. It remains uncertain whether the presence of Delaware influences an upward or downward trend in the level of percentage of population with self-care disability within an area, or if Delaware simply ended up residing in those areas with higher or lower levels of percentage of population with self-care disability due to other factors.
Demographics Similar to Delaware by Self-Care Disability
In terms of self-care disability, the demographic groups most similar to Delaware are Fijian (2.7%, a difference of 0.050%), Apache (2.7%, a difference of 0.070%), Jamaican (2.7%, a difference of 0.080%), Immigrants from Iraq (2.7%, a difference of 0.090%), and Hispanic or Latino (2.7%, a difference of 0.25%).
| Demographics | Rating | Rank | Self-Care Disability |
| Japanese | 0.1 /100 | #276 | Tragic 2.7% |
| Immigrants from Ukraine | 0.1 /100 | #277 | Tragic 2.7% |
| Ottawa | 0.1 /100 | #278 | Tragic 2.7% |
| Iroquois | 0.1 /100 | #279 | Tragic 2.7% |
| Hispanics or Latinos | 0.1 /100 | #280 | Tragic 2.7% |
| Immigrants from Iraq | 0.0 /100 | #281 | Tragic 2.7% |
| Apache | 0.0 /100 | #282 | Tragic 2.7% |
| Delaware | 0.0 /100 | #283 | Tragic 2.7% |
| Fijians | 0.0 /100 | #284 | Tragic 2.7% |
| Jamaicans | 0.0 /100 | #285 | Tragic 2.7% |
| French American Indians | 0.0 /100 | #286 | Tragic 2.7% |
| Immigrants from Jamaica | 0.0 /100 | #287 | Tragic 2.7% |
| Immigrants from Barbados | 0.0 /100 | #288 | Tragic 2.7% |
| Africans | 0.0 /100 | #289 | Tragic 2.7% |
| Cubans | 0.0 /100 | #290 | Tragic 2.7% |
Delaware Self-Care Disability Correlation Summary
| Measurement | Delaware Data | Self-Care Disability Data |
| Minimum | 0.012% | 0.50% |
| Maximum | 11.5% | 9.6% |
| Range | 11.5% | 9.1% |
| Mean | 2.7% | 3.2% |
| Median | 2.1% | 2.9% |
| Interquartile 25% (IQ1) | 0.88% | 2.3% |
| Interquartile 75% (IQ3) | 3.2% | 4.0% |
| Interquartile Range (IQR) | 2.3% | 1.7% |
| Standard Deviation (Sample) | 2.8% | 1.7% |
| Standard Deviation (Population) | 2.8% | 1.7% |
Correlation Details
| Delaware Percentile | Sample Size | Self-Care Disability |
[ 0.0% - 0.5% ] 0.012% | 80,505,466 | 2.6% |
[ 0.0% - 0.5% ] 0.079% | 8,453,733 | 2.4% |
[ 0.0% - 0.5% ] 0.14% | 2,683,521 | 2.4% |
[ 0.0% - 0.5% ] 0.20% | 1,580,628 | 2.5% |
[ 0.0% - 0.5% ] 0.26% | 720,666 | 3.2% |
[ 0.0% - 0.5% ] 0.31% | 475,117 | 2.5% |
[ 0.0% - 0.5% ] 0.37% | 411,610 | 3.0% |
[ 0.0% - 0.5% ] 0.43% | 292,848 | 2.9% |
[ 0.0% - 0.5% ] 0.49% | 189,758 | 2.3% |
[ 0.5% - 1.0% ] 0.55% | 187,605 | 3.1% |
[ 0.5% - 1.0% ] 0.60% | 155,173 | 2.9% |
[ 0.5% - 1.0% ] 0.66% | 66,834 | 2.1% |
[ 0.5% - 1.0% ] 0.72% | 94,733 | 3.4% |
[ 0.5% - 1.0% ] 0.79% | 56,611 | 2.6% |
[ 0.5% - 1.0% ] 0.84% | 15,716 | 5.5% |
[ 0.5% - 1.0% ] 0.88% | 19,518 | 4.1% |
[ 0.5% - 1.0% ] 0.95% | 18,296 | 3.6% |
[ 1.0% - 1.5% ] 1.01% | 16,457 | 3.7% |
[ 1.0% - 1.5% ] 1.06% | 49,209 | 3.4% |
[ 1.0% - 1.5% ] 1.13% | 11,869 | 1.6% |
[ 1.0% - 1.5% ] 1.18% | 39,987 | 3.5% |
[ 1.0% - 1.5% ] 1.23% | 23,772 | 3.1% |
[ 1.0% - 1.5% ] 1.38% | 5,818 | 1.9% |
[ 1.0% - 1.5% ] 1.42% | 3,379 | 2.6% |
[ 1.0% - 1.5% ] 1.48% | 8,780 | 3.0% |
[ 1.5% - 2.0% ] 1.56% | 1,541 | 1.9% |
[ 1.5% - 2.0% ] 1.57% | 1,525 | 4.6% |
[ 1.5% - 2.0% ] 1.64% | 35,349 | 1.4% |
[ 1.5% - 2.0% ] 1.69% | 1,950 | 2.1% |
[ 1.5% - 2.0% ] 1.76% | 5,918 | 2.3% |
[ 1.5% - 2.0% ] 1.87% | 9,024 | 2.0% |
[ 2.0% - 2.5% ] 2.06% | 2,135 | 2.5% |
[ 2.0% - 2.5% ] 2.12% | 2,450 | 4.8% |
[ 2.0% - 2.5% ] 2.16% | 2,917 | 3.6% |
[ 2.0% - 2.5% ] 2.20% | 12,277 | 4.0% |
[ 2.0% - 2.5% ] 2.26% | 1,286 | 7.1% |
[ 2.0% - 2.5% ] 2.34% | 3,034 | 6.4% |
[ 2.0% - 2.5% ] 2.42% | 207 | 2.0% |
[ 2.0% - 2.5% ] 2.45% | 4,077 | 4.0% |
[ 2.5% - 3.0% ] 2.53% | 3,914 | 2.7% |
[ 2.5% - 3.0% ] 2.63% | 1,216 | 0.77% |
[ 2.5% - 3.0% ] 2.67% | 375 | 2.5% |
[ 2.5% - 3.0% ] 2.72% | 1,177 | 4.8% |
[ 2.5% - 3.0% ] 2.82% | 3,194 | 4.0% |
[ 3.0% - 3.5% ] 3.00% | 1,499 | 9.6% |
[ 3.0% - 3.5% ] 3.11% | 2,315 | 3.0% |
[ 3.0% - 3.5% ] 3.12% | 2,528 | 2.3% |
[ 3.0% - 3.5% ] 3.21% | 436 | 2.4% |
[ 3.0% - 3.5% ] 3.36% | 2,114 | 1.4% |
[ 3.0% - 3.5% ] 3.46% | 4,475 | 4.0% |
[ 3.5% - 4.0% ] 3.69% | 1,057 | 2.3% |
[ 3.5% - 4.0% ] 3.72% | 1,938 | 3.0% |
[ 3.5% - 4.0% ] 3.89% | 822 | 0.50% |
[ 4.0% - 4.5% ] 4.46% | 359 | 0.56% |
[ 4.5% - 5.0% ] 4.51% | 532 | 1.8% |
[ 4.5% - 5.0% ] 4.86% | 2,262 | 1.2% |
[ 7.0% - 7.5% ] 7.49% | 2,002 | 1.2% |
[ 7.5% - 8.0% ] 7.58% | 132 | 7.4% |
[ 8.5% - 9.0% ] 8.93% | 929 | 2.9% |
[ 10.5% - 11.0% ] 10.68% | 702 | 6.6% |
[ 11.0% - 11.5% ] 11.11% | 18 | 5.6% |
[ 11.0% - 11.5% ] 11.32% | 468 | 5.2% |
[ 11.5% - 12.0% ] 11.51% | 582 | 3.3% |