Serbian Self-Care Disability

COMPARE

Serbian
Race
Ancestry
AfghanAfricanAlaska NativeAlaskan AthabascanAlbanianAleutAlsatianAmericanApacheArabArapahoArgentineanArmenianAssyrian/Chaldean/SyriacAustralianAustrianBahamianBangladeshiBarbadianBasqueBelgianBelizeanBermudanBhutaneseBlackfeetBolivianBrazilianBritishBritish West IndianBulgarianBurmeseCajunCambodianCanadianCape VerdeanCarpatho RusynCelticCentral AmericanCentral American IndianCherokeeCheyenneChickasawChileanChineseChippewaChoctawColombianColvilleComancheCosta RicanCreeCreekCroatianCrowCubanCypriotCzechCzechoslovakianDanishDelawareDominicanDutchDutch West IndianEastern EuropeanEcuadorianEgyptianEnglishEstonianEthiopianEuropeanFijianFilipinoFinnishFrenchFrench American IndianFrench CanadianGermanGerman RussianGhanaianGreekGuamanian/ChamorroGuatemalanGuyaneseHaitianHmongHonduranHopiHoumaHungarianIcelanderIndian (Asian)IndonesianInupiatIranianIraqiIrishIroquoisIsraeliItalianJamaicanJapaneseJordanianKenyanKiowaKoreanLaotianLatvianLebaneseLiberianLithuanianLumbeeLuxembourgerMacedonianMalaysianMalteseMarshalleseMenomineeMexicanMexican American IndianMongolianMoroccanNative HawaiianNavajoNepaleseNew ZealanderNicaraguanNigerianNorthern EuropeanNorwegianOkinawanOsageOttawaPaiutePakistaniPalestinianPanamanianParaguayanPennsylvania GermanPeruvianPimaPolishPortuguesePotawatomiPuebloPuerto RicanPuget Sound SalishRomanianRussianSalvadoranSamoanScandinavianScotch-IrishScottishSeminoleSenegaleseSerbianShoshoneSierra LeoneanSiouxSlavicSlovakSloveneSomaliSouth AfricanSouth AmericanSouth American IndianSoviet UnionSpaniardSpanishSpanish AmericanSpanish American IndianSri LankanSubsaharan AfricanSudaneseSwedishSwissSyrianTaiwaneseThaiTlingit-HaidaTohono O'OdhamTonganTrinidadian and TobagonianTsimshianTurkishU.S. Virgin IslanderUgandanUkrainianUruguayanUteVenezuelanVietnameseWelshWest IndianYakamaYaquiYugoslavianYumanYup'ikZimbabwean
Immigration
NonimmigrantsImmigrantsAfghanistanAfricaAlbaniaArgentinaArmeniaAsiaAustraliaAustriaBahamasBangladeshBarbadosBelarusBelgiumBelizeBoliviaBosnia and HerzegovinaBrazilBulgariaBurma/MyanmarCabo VerdeCambodiaCameroonCanadaCaribbeanCentral AmericaChileChinaColombiaCongoCosta RicaCroatiaCubaCzechoslovakiaDenmarkDominicaDominican RepublicEastern AfricaEastern AsiaEastern EuropeEcuadorEgyptEl SalvadorEnglandEritreaEthiopiaEuropeFijiFranceGermanyGhanaGreeceGrenadaGuatemalaGuyanaHaitiHondurasHong KongHungaryIndiaIndonesiaIranIraqIrelandIsraelItalyJamaicaJapanJordanKazakhstanKenyaKoreaKuwaitLaosLatin AmericaLatviaLebanonLiberiaLithuaniaMalaysiaMexicoMicronesiaMiddle AfricaMoldovaMoroccoNepalNetherlandsNicaraguaNigeriaNorth AmericaNorth MacedoniaNorthern AfricaNorthern EuropeNorwayOceaniaPakistanPanamaPeruPhilippinesPolandPortugalRomaniaRussiaSaudi ArabiaScotlandSenegalSerbiaSierra LeoneSingaporeSomaliaSouth AfricaSouth AmericaSouth Central AsiaSouth Eastern AsiaSouthern EuropeSpainSri LankaSt. Vincent and the GrenadinesSudanSwedenSwitzerlandSyriaTaiwanThailandTrinidad and TobagoTurkeyUgandaUkraineUruguayUzbekistanVenezuelaVietnamWest IndiesWestern AfricaWestern AsiaWestern EuropeYemenZaireZimbabweAzores
Select to Compare
Race
Ancestry
AfghanAfricanAlaska NativeAlaskan AthabascanAlbanianAleutAlsatianAmericanApacheArabArapahoArgentineanArmenianAssyrian/Chaldean/SyriacAustralianAustrianBahamianBangladeshiBarbadianBasqueBelgianBelizeanBermudanBhutaneseBlackfeetBolivianBrazilianBritishBritish West IndianBulgarianBurmeseCajunCambodianCanadianCape VerdeanCarpatho RusynCelticCentral AmericanCentral American IndianCherokeeCheyenneChickasawChileanChineseChippewaChoctawColombianColvilleComancheCosta RicanCreeCreekCroatianCrowCubanCypriotCzechCzechoslovakianDanishDelawareDominicanDutchDutch West IndianEastern EuropeanEcuadorianEgyptianEnglishEstonianEthiopianEuropeanFijianFilipinoFinnishFrenchFrench American IndianFrench CanadianGermanGerman RussianGhanaianGreekGuamanian/ChamorroGuatemalanGuyaneseHaitianHmongHonduranHopiHoumaHungarianIcelanderIndian (Asian)IndonesianInupiatIranianIraqiIrishIroquoisIsraeliItalianJamaicanJapaneseJordanianKenyanKiowaKoreanLaotianLatvianLebaneseLiberianLithuanianLumbeeLuxembourgerMacedonianMalaysianMalteseMarshalleseMenomineeMexicanMexican American IndianMongolianMoroccanNative HawaiianNavajoNepaleseNew ZealanderNicaraguanNigerianNorthern EuropeanNorwegianOkinawanOsageOttawaPaiutePakistaniPalestinianPanamanianParaguayanPennsylvania GermanPeruvianPimaPolishPortuguesePotawatomiPuebloPuerto RicanPuget Sound SalishRomanianRussianSalvadoranSamoanScandinavianScotch-IrishScottishSeminoleSenegaleseShoshoneSierra LeoneanSiouxSlavicSlovakSloveneSomaliSouth AfricanSouth AmericanSouth American IndianSoviet UnionSpaniardSpanishSpanish AmericanSpanish American IndianSri LankanSubsaharan AfricanSudaneseSwedishSwissSyrianTaiwaneseThaiTlingit-HaidaTohono O'OdhamTonganTrinidadian and TobagonianTsimshianTurkishU.S. Virgin IslanderUgandanUkrainianUruguayanUteVenezuelanVietnameseWelshWest IndianYakamaYaquiYugoslavianYumanYup'ikZimbabwean
Immigration
NonimmigrantsImmigrantsAfghanistanAfricaAlbaniaArgentinaArmeniaAsiaAustraliaAustriaBahamasBangladeshBarbadosBelarusBelgiumBelizeBoliviaBosnia and HerzegovinaBrazilBulgariaBurma/MyanmarCabo VerdeCambodiaCameroonCanadaCaribbeanCentral AmericaChileChinaColombiaCongoCosta RicaCroatiaCubaCzechoslovakiaDenmarkDominicaDominican RepublicEastern AfricaEastern AsiaEastern EuropeEcuadorEgyptEl SalvadorEnglandEritreaEthiopiaEuropeFijiFranceGermanyGhanaGreeceGrenadaGuatemalaGuyanaHaitiHondurasHong KongHungaryIndiaIndonesiaIranIraqIrelandIsraelItalyJamaicaJapanJordanKazakhstanKenyaKoreaKuwaitLaosLatin AmericaLatviaLebanonLiberiaLithuaniaMalaysiaMexicoMicronesiaMiddle AfricaMoldovaMoroccoNepalNetherlandsNicaraguaNigeriaNorth AmericaNorth MacedoniaNorthern AfricaNorthern EuropeNorwayOceaniaPakistanPanamaPeruPhilippinesPolandPortugalRomaniaRussiaSaudi ArabiaScotlandSenegalSerbiaSierra LeoneSingaporeSomaliaSouth AfricaSouth AmericaSouth Central AsiaSouth Eastern AsiaSouthern EuropeSpainSri LankaSt. Vincent and the GrenadinesSudanSwedenSwitzerlandSyriaTaiwanThailandTrinidad and TobagoTurkeyUgandaUkraineUruguayUzbekistanVenezuelaVietnamWest IndiesWestern AfricaWestern AsiaWestern EuropeYemenZaireZimbabweAzores
Self-Care Disability
Income
Poverty
Unemployment
Labor Participation
Family Structure
Vehicle Availability
Education Level
Disability

Serbian Self-Care Disability
Exceptional

2.4%
SELF-CARE DISABILITY
93.6/ 100
METRIC RATING
111th/ 347
METRIC RANK

Serbian Self-Care Disability Correlation Chart

The statistical analysis conducted on geographies consisting of 267,466,690 people shows a significant positive correlation between the proportion of Serbians and percentage of population with self-care disability in the United States with a correlation coefficient (R) of 0.656 and weighted average of 2.4%. On average, for every 1% (one percent) increase in Serbians within a typical geography, there is an increase of 0.25% in percentage of population with self-care disability.
Serbian Self-Care Disability
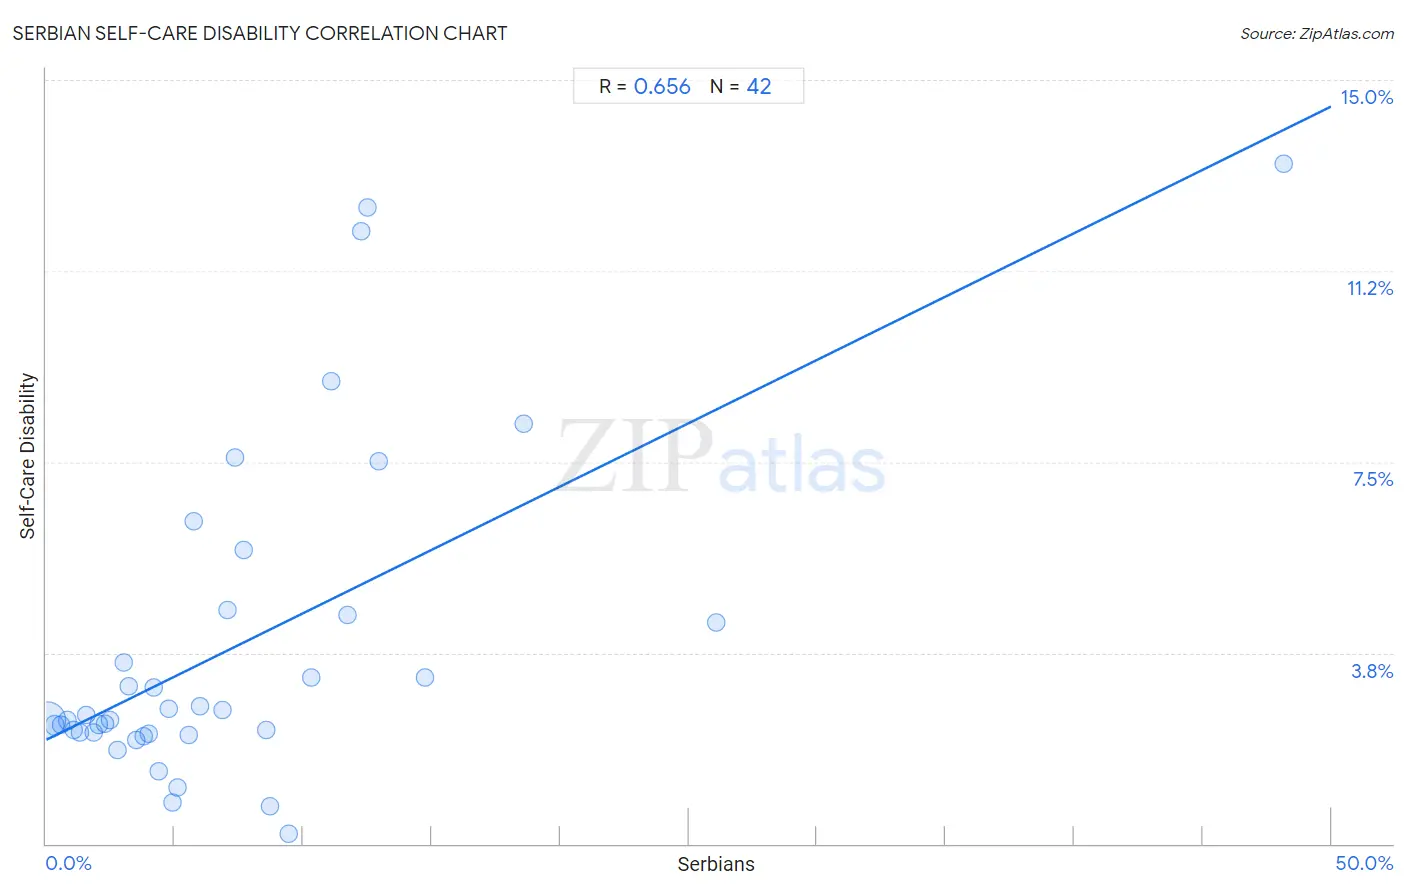
It is essential to understand that the correlation between the percentage of Serbians and percentage of population with self-care disability does not imply a direct cause-and-effect relationship. It remains uncertain whether the presence of Serbians influences an upward or downward trend in the level of percentage of population with self-care disability within an area, or if Serbians simply ended up residing in those areas with higher or lower levels of percentage of population with self-care disability due to other factors.

Demographics Similar to Serbians by Self-Care Disability

In terms of self-care disability, the demographic groups most similar to Serbians are Immigrants from Africa (2.4%, a difference of 0.020%), Scandinavian (2.4%, a difference of 0.020%), South American (2.4%, a difference of 0.090%), Immigrants from North Macedonia (2.4%, a difference of 0.090%), and Immigrants from Hong Kong (2.4%, a difference of 0.090%).
DemographicsRating | RankSelf-Care Disability
Bhutanese
94.5
/100
|
#104
Exceptional
2.4%
Carpatho Rusyns
94.4
/100
|
#105
Exceptional
2.4%
Immigrants from Indonesia
94.3
/100
|
#106
Exceptional
2.4%
British
94.3
/100
|
#107
Exceptional
2.4%
Greeks
94.1
/100
|
#108
Exceptional
2.4%
Slovenes
94.1
/100
|
#109
Exceptional
2.4%
Immigrants from Africa
93.7
/100
|
#110
Exceptional
2.4%
Serbians
93.6
/100
|
#111
Exceptional
2.4%
Scandinavians
93.5
/100
|
#112
Exceptional
2.4%
South Americans
93.2
/100
|
#113
Exceptional
2.4%
Immigrants from North Macedonia
93.1
/100
|
#114
Exceptional
2.4%
Immigrants from Hong Kong
93.1
/100
|
#115
Exceptional
2.4%
Northern Europeans
92.9
/100
|
#116
Exceptional
2.4%
Taiwanese
92.5
/100
|
#117
Exceptional
2.4%
Immigrants from Canada
92.0
/100
|
#118
Exceptional
2.4%

Serbian Self-Care Disability Correlation Summary

MeasurementSerbian DataSelf-Care Disability Data
Minimum0.068%0.20%
Maximum48.1%13.4%
Range48.1%13.2%
Mean7.4%3.9%
Median5.0%2.5%
Interquartile 25% (IQ1)2.5%2.2%
Interquartile 75% (IQ3)9.4%4.5%
Interquartile Range (IQR)7.0%2.3%
Standard Deviation (Sample)8.4%3.2%
Standard Deviation (Population)8.3%3.1%

Correlation Details

Serbian PercentileSample SizeSelf-Care Disability
[
0.0%
-
0.5%
]
0.068%
232,484,1052.4%
[
0.0%
-
0.5%
]
0.32%
22,500,0372.3%
[
0.5%
-
1.0%
]
0.58%
5,966,1822.3%
[
0.5%
-
1.0%
]
0.83%
2,564,5512.4%
[
1.0%
-
1.5%
]
1.09%
1,534,1002.2%
[
1.0%
-
1.5%
]
1.32%
799,9402.2%
[
1.5%
-
2.0%
]
1.56%
332,0232.5%
[
1.5%
-
2.0%
]
1.83%
584,9782.2%
[
2.0%
-
2.5%
]
2.05%
263,0452.3%
[
2.0%
-
2.5%
]
2.30%
75,7502.4%
[
2.0%
-
2.5%
]
2.48%
97,7732.4%
[
2.5%
-
3.0%
]
2.78%
34,0161.8%
[
3.0%
-
3.5%
]
3.01%
20,4523.6%
[
3.0%
-
3.5%
]
3.21%
28,2523.1%
[
3.5%
-
4.0%
]
3.53%
40,1942.0%
[
3.5%
-
4.0%
]
3.81%
4,8332.1%
[
3.5%
-
4.0%
]
3.99%
48,5942.2%
[
4.0%
-
4.5%
]
4.21%
42,2663.1%
[
4.0%
-
4.5%
]
4.37%
4,8691.4%
[
4.5%
-
5.0%
]
4.77%
4,0222.7%
[
4.5%
-
5.0%
]
4.89%
1,8390.82%
[
5.0%
-
5.5%
]
5.13%
6,8031.1%
[
5.5%
-
6.0%
]
5.52%
3,7482.1%
[
5.5%
-
6.0%
]
5.74%
3836.3%
[
5.5%
-
6.0%
]
5.96%
4,3772.7%
[
6.5%
-
7.0%
]
6.85%
6,2212.6%
[
7.0%
-
7.5%
]
7.04%
1,5344.6%
[
7.0%
-
7.5%
]
7.35%
687.6%
[
7.5%
-
8.0%
]
7.68%
1,7715.8%
[
8.5%
-
9.0%
]
8.58%
2,2032.2%
[
8.5%
-
9.0%
]
8.70%
2990.73%
[
9.0%
-
9.5%
]
9.44%
1,8850.20%
[
10.0%
-
10.5%
]
10.33%
1,4723.3%
[
11.0%
-
11.5%
]
11.11%
999.1%
[
11.5%
-
12.0%
]
11.71%
1,6834.5%
[
12.0%
-
12.5%
]
12.24%
29412.0%
[
12.0%
-
12.5%
]
12.50%
1612.5%
[
12.5%
-
13.0%
]
12.92%
3257.5%
[
14.5%
-
15.0%
]
14.71%
1,0333.3%
[
18.5%
-
19.0%
]
18.56%
2918.2%
[
26.0%
-
26.5%
]
26.09%
694.3%
[
48.0%
-
48.5%
]
48.14%
29513.4%