Scotch-Irish Divorced or Separated
COMPARE
Scotch-Irish
Select to Compare
Divorced or Separated
Scotch-Irish Divorced or Separated
12.9%
DIVORCED OR SEPARATED
0.0/ 100
METRIC RATING
292nd/ 347
METRIC RANK
Scotch-Irish Divorced or Separated Correlation Chart
The statistical analysis conducted on geographies consisting of 548,485,641 people shows a moderate positive correlation between the proportion of Scotch-Irish and percentage of population currently divorced or separated in the United States with a correlation coefficient (R) of 0.451 and weighted average of 12.9%. On average, for every 1% (one percent) increase in Scotch-Irish within a typical geography, there is an increase of 0.37% in percentage of population currently divorced or separated.
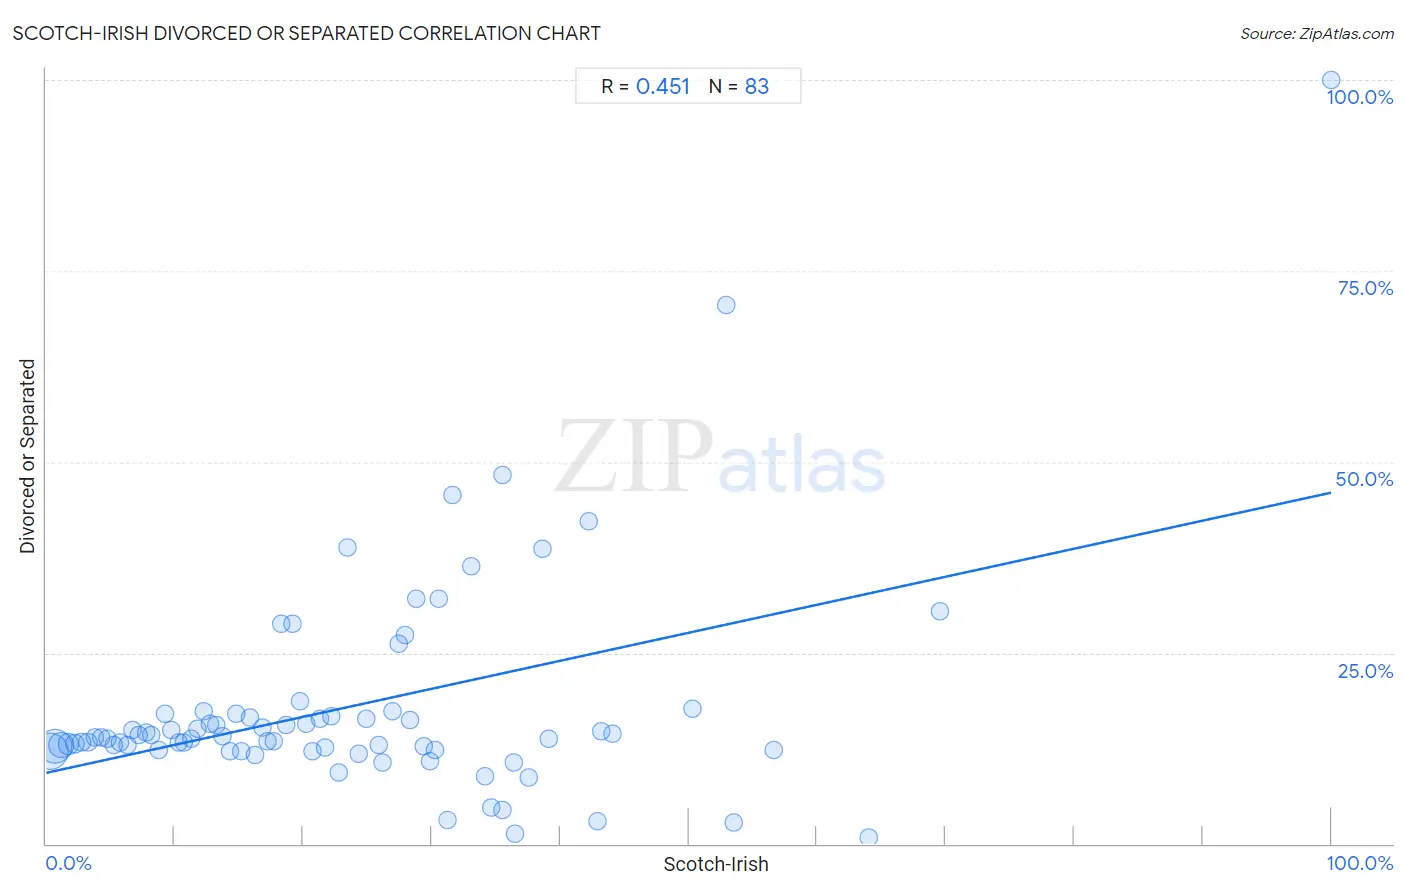
It is essential to understand that the correlation between the percentage of Scotch-Irish and percentage of population currently divorced or separated does not imply a direct cause-and-effect relationship. It remains uncertain whether the presence of Scotch-Irish influences an upward or downward trend in the level of percentage of population currently divorced or separated within an area, or if Scotch-Irish simply ended up residing in those areas with higher or lower levels of percentage of population currently divorced or separated due to other factors.
Demographics Similar to Scotch-Irish by Divorced or Separated
In terms of divorced or separated, the demographic groups most similar to Scotch-Irish are Immigrants from Honduras (12.9%, a difference of 0.060%), Pima (12.9%, a difference of 0.17%), Jamaican (12.9%, a difference of 0.21%), Apache (12.9%, a difference of 0.24%), and Iroquois (12.9%, a difference of 0.32%).
| Demographics | Rating | Rank | Divorced or Separated |
| French | 0.1 /100 | #285 | Tragic 12.8% |
| Spanish | 0.1 /100 | #286 | Tragic 12.8% |
| Hondurans | 0.1 /100 | #287 | Tragic 12.8% |
| French Canadians | 0.1 /100 | #288 | Tragic 12.8% |
| Iroquois | 0.0 /100 | #289 | Tragic 12.9% |
| Pima | 0.0 /100 | #290 | Tragic 12.9% |
| Immigrants from Honduras | 0.0 /100 | #291 | Tragic 12.9% |
| Scotch-Irish | 0.0 /100 | #292 | Tragic 12.9% |
| Jamaicans | 0.0 /100 | #293 | Tragic 12.9% |
| Apache | 0.0 /100 | #294 | Tragic 12.9% |
| Celtics | 0.0 /100 | #295 | Tragic 13.0% |
| Nicaraguans | 0.0 /100 | #296 | Tragic 13.0% |
| Natives/Alaskans | 0.0 /100 | #297 | Tragic 13.0% |
| Venezuelans | 0.0 /100 | #298 | Tragic 13.0% |
| Immigrants from Jamaica | 0.0 /100 | #299 | Tragic 13.0% |
Scotch-Irish Divorced or Separated Correlation Summary
| Measurement | Scotch-Irish Data | Divorced or Separated Data |
| Minimum | 0.25% | 0.80% |
| Maximum | 100.0% | 100.0% |
| Range | 99.7% | 99.2% |
| Mean | 23.6% | 17.9% |
| Median | 20.7% | 13.9% |
| Interquartile 25% (IQ1) | 10.3% | 12.3% |
| Interquartile 75% (IQ3) | 33.1% | 17.0% |
| Interquartile Range (IQR) | 22.8% | 4.7% |
| Standard Deviation (Sample) | 17.6% | 14.3% |
| Standard Deviation (Population) | 17.5% | 14.2% |
Correlation Details
| Scotch-Irish Percentile | Sample Size | Divorced or Separated |
[ 0.0% - 0.5% ] 0.25% | 210,659,722 | 12.0% |
[ 0.5% - 1.0% ] 0.72% | 183,237,078 | 12.8% |
[ 1.0% - 1.5% ] 1.21% | 82,706,023 | 12.9% |
[ 1.5% - 2.0% ] 1.72% | 36,456,405 | 13.0% |
[ 2.0% - 2.5% ] 2.21% | 15,918,141 | 13.1% |
[ 2.5% - 3.0% ] 2.73% | 7,863,355 | 13.3% |
[ 3.0% - 3.5% ] 3.23% | 5,135,081 | 13.3% |
[ 3.5% - 4.0% ] 3.75% | 2,458,563 | 14.0% |
[ 4.0% - 4.5% ] 4.25% | 1,277,139 | 13.9% |
[ 4.5% - 5.0% ] 4.76% | 750,754 | 13.7% |
[ 5.0% - 5.5% ] 5.23% | 644,308 | 13.0% |
[ 5.5% - 6.0% ] 5.71% | 326,849 | 13.2% |
[ 6.0% - 6.5% ] 6.29% | 211,315 | 12.9% |
[ 6.5% - 7.0% ] 6.71% | 139,180 | 14.9% |
[ 7.0% - 7.5% ] 7.24% | 122,498 | 14.3% |
[ 7.5% - 8.0% ] 7.78% | 112,122 | 14.5% |
[ 8.0% - 8.5% ] 8.22% | 77,125 | 14.2% |
[ 8.5% - 9.0% ] 8.75% | 61,293 | 12.3% |
[ 9.0% - 9.5% ] 9.25% | 40,511 | 17.0% |
[ 9.5% - 10.0% ] 9.76% | 38,931 | 15.0% |
[ 10.0% - 10.5% ] 10.27% | 38,672 | 13.2% |
[ 10.5% - 11.0% ] 10.70% | 27,235 | 13.3% |
[ 11.0% - 11.5% ] 11.24% | 19,953 | 13.7% |
[ 11.5% - 12.0% ] 11.80% | 18,500 | 15.1% |
[ 12.0% - 12.5% ] 12.23% | 9,116 | 17.3% |
[ 12.5% - 13.0% ] 12.75% | 4,511 | 15.7% |
[ 13.0% - 13.5% ] 13.22% | 19,125 | 15.6% |
[ 13.5% - 14.0% ] 13.70% | 16,630 | 14.2% |
[ 14.0% - 14.5% ] 14.26% | 15,916 | 12.2% |
[ 14.5% - 15.0% ] 14.82% | 3,670 | 17.0% |
[ 15.0% - 15.5% ] 15.17% | 6,091 | 12.2% |
[ 15.5% - 16.0% ] 15.86% | 5,354 | 16.6% |
[ 16.0% - 16.5% ] 16.20% | 11,312 | 11.6% |
[ 16.5% - 17.0% ] 16.81% | 5,240 | 15.3% |
[ 17.0% - 17.5% ] 17.25% | 7,843 | 13.5% |
[ 17.5% - 18.0% ] 17.66% | 9,569 | 13.5% |
[ 18.0% - 18.5% ] 18.30% | 2,300 | 28.8% |
[ 18.5% - 19.0% ] 18.65% | 2,965 | 15.5% |
[ 19.0% - 19.5% ] 19.14% | 972 | 28.8% |
[ 19.5% - 20.0% ] 19.72% | 1,359 | 18.7% |
[ 20.0% - 20.5% ] 20.26% | 770 | 15.7% |
[ 20.5% - 21.0% ] 20.73% | 2,750 | 12.1% |
[ 21.0% - 21.5% ] 21.29% | 1,104 | 16.4% |
[ 21.5% - 22.0% ] 21.70% | 1,562 | 12.6% |
[ 22.0% - 22.5% ] 22.22% | 18 | 16.7% |
[ 22.5% - 23.0% ] 22.77% | 1,256 | 9.3% |
[ 23.0% - 23.5% ] 23.42% | 1,029 | 38.8% |
[ 24.0% - 24.5% ] 24.34% | 226 | 11.8% |
[ 24.5% - 25.0% ] 24.86% | 1,943 | 16.4% |
[ 25.5% - 26.0% ] 25.83% | 724 | 13.0% |
[ 26.0% - 26.5% ] 26.17% | 405 | 10.6% |
[ 26.5% - 27.0% ] 26.91% | 431 | 17.4% |
[ 27.0% - 27.5% ] 27.42% | 383 | 26.1% |
[ 27.5% - 28.0% ] 27.91% | 86 | 27.3% |
[ 28.0% - 28.5% ] 28.26% | 92 | 16.2% |
[ 28.5% - 29.0% ] 28.81% | 361 | 32.1% |
[ 29.0% - 29.5% ] 29.42% | 469 | 12.8% |
[ 29.5% - 30.0% ] 29.83% | 905 | 10.8% |
[ 30.0% - 30.5% ] 30.26% | 3,024 | 12.3% |
[ 30.5% - 31.0% ] 30.57% | 386 | 32.0% |
[ 31.0% - 31.5% ] 31.25% | 32 | 3.1% |
[ 31.5% - 32.0% ] 31.65% | 79 | 45.6% |
[ 33.0% - 33.5% ] 33.06% | 121 | 36.4% |
[ 34.0% - 34.5% ] 34.12% | 847 | 8.8% |
[ 34.5% - 35.0% ] 34.59% | 185 | 4.8% |
[ 35.0% - 35.5% ] 35.46% | 141 | 4.4% |
[ 35.5% - 36.0% ] 35.54% | 166 | 48.2% |
[ 36.0% - 36.5% ] 36.40% | 728 | 10.6% |
[ 36.5% - 37.0% ] 36.51% | 556 | 1.3% |
[ 37.5% - 38.0% ] 37.58% | 157 | 8.6% |
[ 38.5% - 39.0% ] 38.61% | 101 | 38.6% |
[ 39.0% - 39.5% ] 39.08% | 87 | 13.8% |
[ 42.0% - 42.5% ] 42.19% | 64 | 42.2% |
[ 42.5% - 43.0% ] 42.86% | 35 | 2.9% |
[ 43.0% - 43.5% ] 43.17% | 556 | 14.8% |
[ 44.0% - 44.5% ] 44.08% | 338 | 14.4% |
[ 50.0% - 50.5% ] 50.34% | 149 | 17.7% |
[ 52.5% - 53.0% ] 52.94% | 17 | 70.6% |
[ 53.5% - 54.0% ] 53.51% | 299 | 2.8% |
[ 56.5% - 57.0% ] 56.63% | 83 | 12.2% |
[ 64.0% - 64.5% ] 64.00% | 175 | 0.80% |
[ 69.5% - 70.0% ] 69.57% | 23 | 30.4% |
[ 99.5% - 100.0% ] 100.00% | 52 | 100.0% |