Houma Self-Care Disability
COMPARE
Houma
Select to Compare
Self-Care Disability
Houma Self-Care Disability
3.0%
SELF-CARE DISABILITY
0.0/ 100
METRIC RATING
334th/ 347
METRIC RANK
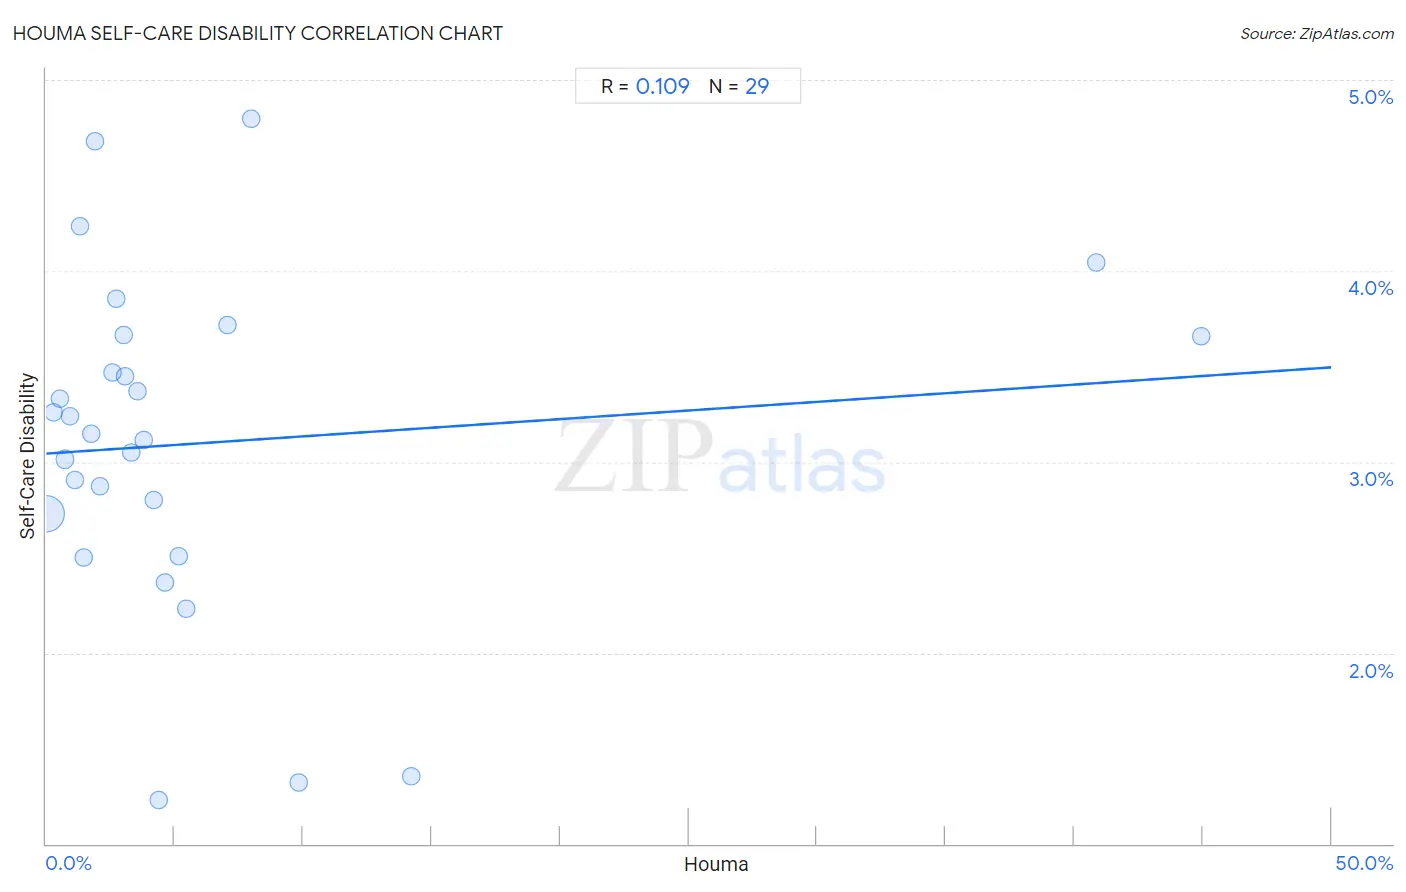
Houma Self-Care Disability Correlation Chart
The statistical analysis conducted on geographies consisting of 36,783,442 people shows a poor positive correlation between the proportion of Houma and percentage of population with self-care disability in the United States with a correlation coefficient (R) of 0.109 and weighted average of 3.0%. On average, for every 1% (one percent) increase in Houma within a typical geography, there is an increase of 0.0090% in percentage of population with self-care disability.
It is essential to understand that the correlation between the percentage of Houma and percentage of population with self-care disability does not imply a direct cause-and-effect relationship. It remains uncertain whether the presence of Houma influences an upward or downward trend in the level of percentage of population with self-care disability within an area, or if Houma simply ended up residing in those areas with higher or lower levels of percentage of population with self-care disability due to other factors.
Demographics Similar to Houma by Self-Care Disability
In terms of self-care disability, the demographic groups most similar to Houma are Immigrants from the Azores (3.0%, a difference of 0.050%), Dutch West Indian (3.0%, a difference of 0.070%), Immigrants from Yemen (3.0%, a difference of 0.21%), Kiowa (3.0%, a difference of 0.30%), and Lumbee (3.0%, a difference of 0.66%).
| Demographics | Rating | Rank | Self-Care Disability |
| Blacks/African Americans | 0.0 /100 | #327 | Tragic 2.9% |
| Hopi | 0.0 /100 | #328 | Tragic 2.9% |
| Cajuns | 0.0 /100 | #329 | Tragic 2.9% |
| Nepalese | 0.0 /100 | #330 | Tragic 3.0% |
| Lumbee | 0.0 /100 | #331 | Tragic 3.0% |
| Kiowa | 0.0 /100 | #332 | Tragic 3.0% |
| Dutch West Indians | 0.0 /100 | #333 | Tragic 3.0% |
| Houma | 0.0 /100 | #334 | Tragic 3.0% |
| Immigrants from the Azores | 0.0 /100 | #335 | Tragic 3.0% |
| Immigrants from Yemen | 0.0 /100 | #336 | Tragic 3.0% |
| Choctaw | 0.0 /100 | #337 | Tragic 3.0% |
| Cape Verdeans | 0.0 /100 | #338 | Tragic 3.0% |
| Immigrants from Dominican Republic | 0.0 /100 | #339 | Tragic 3.0% |
| Immigrants from Cabo Verde | 0.0 /100 | #340 | Tragic 3.1% |
| Dominicans | 0.0 /100 | #341 | Tragic 3.1% |
Houma Self-Care Disability Correlation Summary
| Measurement | Houma Data | Self-Care Disability Data |
| Minimum | 0.012% | 1.2% |
| Maximum | 44.9% | 4.8% |
| Range | 44.9% | 3.6% |
| Mean | 6.3% | 3.1% |
| Median | 3.1% | 3.1% |
| Interquartile 25% (IQ1) | 1.4% | 2.6% |
| Interquartile 75% (IQ3) | 5.3% | 3.7% |
| Interquartile Range (IQR) | 3.9% | 1.0% |
| Standard Deviation (Sample) | 10.6% | 0.88% |
| Standard Deviation (Population) | 10.4% | 0.86% |
Correlation Details
| Houma Percentile | Sample Size | Self-Care Disability |
[ 0.0% - 0.5% ] 0.012% | 35,258,017 | 2.7% |
[ 0.0% - 0.5% ] 0.28% | 564,778 | 3.3% |
[ 0.5% - 1.0% ] 0.52% | 300,673 | 3.3% |
[ 0.5% - 1.0% ] 0.71% | 264,900 | 3.0% |
[ 0.5% - 1.0% ] 0.93% | 85,949 | 3.2% |
[ 1.0% - 1.5% ] 1.10% | 43,230 | 2.9% |
[ 1.0% - 1.5% ] 1.32% | 4,545 | 4.2% |
[ 1.0% - 1.5% ] 1.47% | 25,087 | 2.5% |
[ 1.5% - 2.0% ] 1.77% | 15,031 | 3.1% |
[ 1.5% - 2.0% ] 1.89% | 11,415 | 4.7% |
[ 2.0% - 2.5% ] 2.09% | 8,600 | 2.9% |
[ 2.5% - 3.0% ] 2.58% | 9,287 | 3.5% |
[ 2.5% - 3.0% ] 2.71% | 7,961 | 3.9% |
[ 2.5% - 3.0% ] 3.00% | 26,788 | 3.7% |
[ 3.0% - 3.5% ] 3.09% | 5,118 | 3.4% |
[ 3.0% - 3.5% ] 3.31% | 5,677 | 3.0% |
[ 3.5% - 4.0% ] 3.56% | 33,094 | 3.4% |
[ 3.5% - 4.0% ] 3.79% | 15,373 | 3.1% |
[ 4.0% - 4.5% ] 4.21% | 11,624 | 2.8% |
[ 4.0% - 4.5% ] 4.40% | 2,386 | 1.2% |
[ 4.5% - 5.0% ] 4.63% | 30,192 | 2.4% |
[ 5.0% - 5.5% ] 5.16% | 35,760 | 2.5% |
[ 5.0% - 5.5% ] 5.46% | 5,845 | 2.2% |
[ 7.0% - 7.5% ] 7.04% | 3,762 | 3.7% |
[ 7.5% - 8.0% ] 7.99% | 2,880 | 4.8% |
[ 9.5% - 10.0% ] 9.84% | 2,511 | 1.3% |
[ 14.0% - 14.5% ] 14.18% | 1,347 | 1.4% |
[ 40.5% - 41.0% ] 40.88% | 844 | 4.0% |
[ 44.5% - 45.0% ] 44.92% | 768 | 3.7% |