Immigrants from Northern Europe Self-Care Disability

COMPARE

Immigrants from Northern Europe
Race
Ancestry
AfghanAfricanAlaska NativeAlaskan AthabascanAlbanianAleutAlsatianAmericanApacheArabArapahoArgentineanArmenianAssyrian/Chaldean/SyriacAustralianAustrianBahamianBangladeshiBarbadianBasqueBelgianBelizeanBermudanBhutaneseBlackfeetBolivianBrazilianBritishBritish West IndianBulgarianBurmeseCajunCambodianCanadianCape VerdeanCarpatho RusynCelticCentral AmericanCentral American IndianCherokeeCheyenneChickasawChileanChineseChippewaChoctawColombianColvilleComancheCosta RicanCreeCreekCroatianCrowCubanCypriotCzechCzechoslovakianDanishDelawareDominicanDutchDutch West IndianEastern EuropeanEcuadorianEgyptianEnglishEstonianEthiopianEuropeanFijianFilipinoFinnishFrenchFrench American IndianFrench CanadianGermanGerman RussianGhanaianGreekGuamanian/ChamorroGuatemalanGuyaneseHaitianHmongHonduranHopiHoumaHungarianIcelanderIndian (Asian)IndonesianInupiatIranianIraqiIrishIroquoisIsraeliItalianJamaicanJapaneseJordanianKenyanKiowaKoreanLaotianLatvianLebaneseLiberianLithuanianLumbeeLuxembourgerMacedonianMalaysianMalteseMarshalleseMenomineeMexicanMexican American IndianMongolianMoroccanNative HawaiianNavajoNepaleseNew ZealanderNicaraguanNigerianNorthern EuropeanNorwegianOkinawanOsageOttawaPaiutePakistaniPalestinianPanamanianParaguayanPennsylvania GermanPeruvianPimaPolishPortuguesePotawatomiPuebloPuerto RicanPuget Sound SalishRomanianRussianSalvadoranSamoanScandinavianScotch-IrishScottishSeminoleSenegaleseSerbianShoshoneSierra LeoneanSiouxSlavicSlovakSloveneSomaliSouth AfricanSouth AmericanSouth American IndianSoviet UnionSpaniardSpanishSpanish AmericanSpanish American IndianSri LankanSubsaharan AfricanSudaneseSwedishSwissSyrianTaiwaneseThaiTlingit-HaidaTohono O'OdhamTonganTrinidadian and TobagonianTsimshianTurkishU.S. Virgin IslanderUgandanUkrainianUruguayanUteVenezuelanVietnameseWelshWest IndianYakamaYaquiYugoslavianYumanYup'ikZimbabwean
Immigration
NonimmigrantsImmigrantsAfghanistanAfricaAlbaniaArgentinaArmeniaAsiaAustraliaAustriaBahamasBangladeshBarbadosBelarusBelgiumBelizeBoliviaBosnia and HerzegovinaBrazilBulgariaBurma/MyanmarCabo VerdeCambodiaCameroonCanadaCaribbeanCentral AmericaChileChinaColombiaCongoCosta RicaCroatiaCubaCzechoslovakiaDenmarkDominicaDominican RepublicEastern AfricaEastern AsiaEastern EuropeEcuadorEgyptEl SalvadorEnglandEritreaEthiopiaEuropeFijiFranceGermanyGhanaGreeceGrenadaGuatemalaGuyanaHaitiHondurasHong KongHungaryIndiaIndonesiaIranIraqIrelandIsraelItalyJamaicaJapanJordanKazakhstanKenyaKoreaKuwaitLaosLatin AmericaLatviaLebanonLiberiaLithuaniaMalaysiaMexicoMicronesiaMiddle AfricaMoldovaMoroccoNepalNetherlandsNicaraguaNigeriaNorth AmericaNorth MacedoniaNorthern AfricaNorthern EuropeNorwayOceaniaPakistanPanamaPeruPhilippinesPolandPortugalRomaniaRussiaSaudi ArabiaScotlandSenegalSerbiaSierra LeoneSingaporeSomaliaSouth AfricaSouth AmericaSouth Central AsiaSouth Eastern AsiaSouthern EuropeSpainSri LankaSt. Vincent and the GrenadinesSudanSwedenSwitzerlandSyriaTaiwanThailandTrinidad and TobagoTurkeyUgandaUkraineUruguayUzbekistanVenezuelaVietnamWest IndiesWestern AfricaWestern AsiaWestern EuropeYemenZaireZimbabweAzores
Select to Compare
Race
Ancestry
AfghanAfricanAlaska NativeAlaskan AthabascanAlbanianAleutAlsatianAmericanApacheArabArapahoArgentineanArmenianAssyrian/Chaldean/SyriacAustralianAustrianBahamianBangladeshiBarbadianBasqueBelgianBelizeanBermudanBhutaneseBlackfeetBolivianBrazilianBritishBritish West IndianBulgarianBurmeseCajunCambodianCanadianCape VerdeanCarpatho RusynCelticCentral AmericanCentral American IndianCherokeeCheyenneChickasawChileanChineseChippewaChoctawColombianColvilleComancheCosta RicanCreeCreekCroatianCrowCubanCypriotCzechCzechoslovakianDanishDelawareDominicanDutchDutch West IndianEastern EuropeanEcuadorianEgyptianEnglishEstonianEthiopianEuropeanFijianFilipinoFinnishFrenchFrench American IndianFrench CanadianGermanGerman RussianGhanaianGreekGuamanian/ChamorroGuatemalanGuyaneseHaitianHmongHonduranHopiHoumaHungarianIcelanderIndian (Asian)IndonesianInupiatIranianIraqiIrishIroquoisIsraeliItalianJamaicanJapaneseJordanianKenyanKiowaKoreanLaotianLatvianLebaneseLiberianLithuanianLumbeeLuxembourgerMacedonianMalaysianMalteseMarshalleseMenomineeMexicanMexican American IndianMongolianMoroccanNative HawaiianNavajoNepaleseNew ZealanderNicaraguanNigerianNorthern EuropeanNorwegianOkinawanOsageOttawaPaiutePakistaniPalestinianPanamanianParaguayanPennsylvania GermanPeruvianPimaPolishPortuguesePotawatomiPuebloPuerto RicanPuget Sound SalishRomanianRussianSalvadoranSamoanScandinavianScotch-IrishScottishSeminoleSenegaleseSerbianShoshoneSierra LeoneanSiouxSlavicSlovakSloveneSomaliSouth AfricanSouth AmericanSouth American IndianSoviet UnionSpaniardSpanishSpanish AmericanSpanish American IndianSri LankanSubsaharan AfricanSudaneseSwedishSwissSyrianTaiwaneseThaiTlingit-HaidaTohono O'OdhamTonganTrinidadian and TobagonianTsimshianTurkishU.S. Virgin IslanderUgandanUkrainianUruguayanUteVenezuelanVietnameseWelshWest IndianYakamaYaquiYugoslavianYumanYup'ikZimbabwean
Immigration
NonimmigrantsImmigrantsAfghanistanAfricaAlbaniaArgentinaArmeniaAsiaAustraliaAustriaBahamasBangladeshBarbadosBelarusBelgiumBelizeBoliviaBosnia and HerzegovinaBrazilBulgariaBurma/MyanmarCabo VerdeCambodiaCameroonCanadaCaribbeanCentral AmericaChileChinaColombiaCongoCosta RicaCroatiaCubaCzechoslovakiaDenmarkDominicaDominican RepublicEastern AfricaEastern AsiaEastern EuropeEcuadorEgyptEl SalvadorEnglandEritreaEthiopiaEuropeFijiFranceGermanyGhanaGreeceGrenadaGuatemalaGuyanaHaitiHondurasHong KongHungaryIndiaIndonesiaIranIraqIrelandIsraelItalyJamaicaJapanJordanKazakhstanKenyaKoreaKuwaitLaosLatin AmericaLatviaLebanonLiberiaLithuaniaMalaysiaMexicoMicronesiaMiddle AfricaMoldovaMoroccoNepalNetherlandsNicaraguaNigeriaNorth AmericaNorth MacedoniaNorthern AfricaNorwayOceaniaPakistanPanamaPeruPhilippinesPolandPortugalRomaniaRussiaSaudi ArabiaScotlandSenegalSerbiaSierra LeoneSingaporeSomaliaSouth AfricaSouth AmericaSouth Central AsiaSouth Eastern AsiaSouthern EuropeSpainSri LankaSt. Vincent and the GrenadinesSudanSwedenSwitzerlandSyriaTaiwanThailandTrinidad and TobagoTurkeyUgandaUkraineUruguayUzbekistanVenezuelaVietnamWest IndiesWestern AfricaWestern AsiaWestern EuropeYemenZaireZimbabweAzores
Self-Care Disability
Income
Poverty
Unemployment
Labor Participation
Family Structure
Vehicle Availability
Education Level
Disability

Immigrants from Northern Europe Self-Care Disability
Exceptional

2.3%
SELF-CARE DISABILITY
99.2/ 100
METRIC RATING
70th/ 347
METRIC RANK

Immigrants from Northern Europe Self-Care Disability Correlation Chart

The statistical analysis conducted on geographies consisting of 476,375,599 people shows a very strong positive correlation between the proportion of Immigrants from Northern Europe and percentage of population with self-care disability in the United States with a correlation coefficient (R) of 0.893 and weighted average of 2.3%. On average, for every 1% (one percent) increase in Immigrants from Northern Europe within a typical geography, there is an increase of 0.54% in percentage of population with self-care disability.
Immigrants from Northern Europe Self-Care Disability
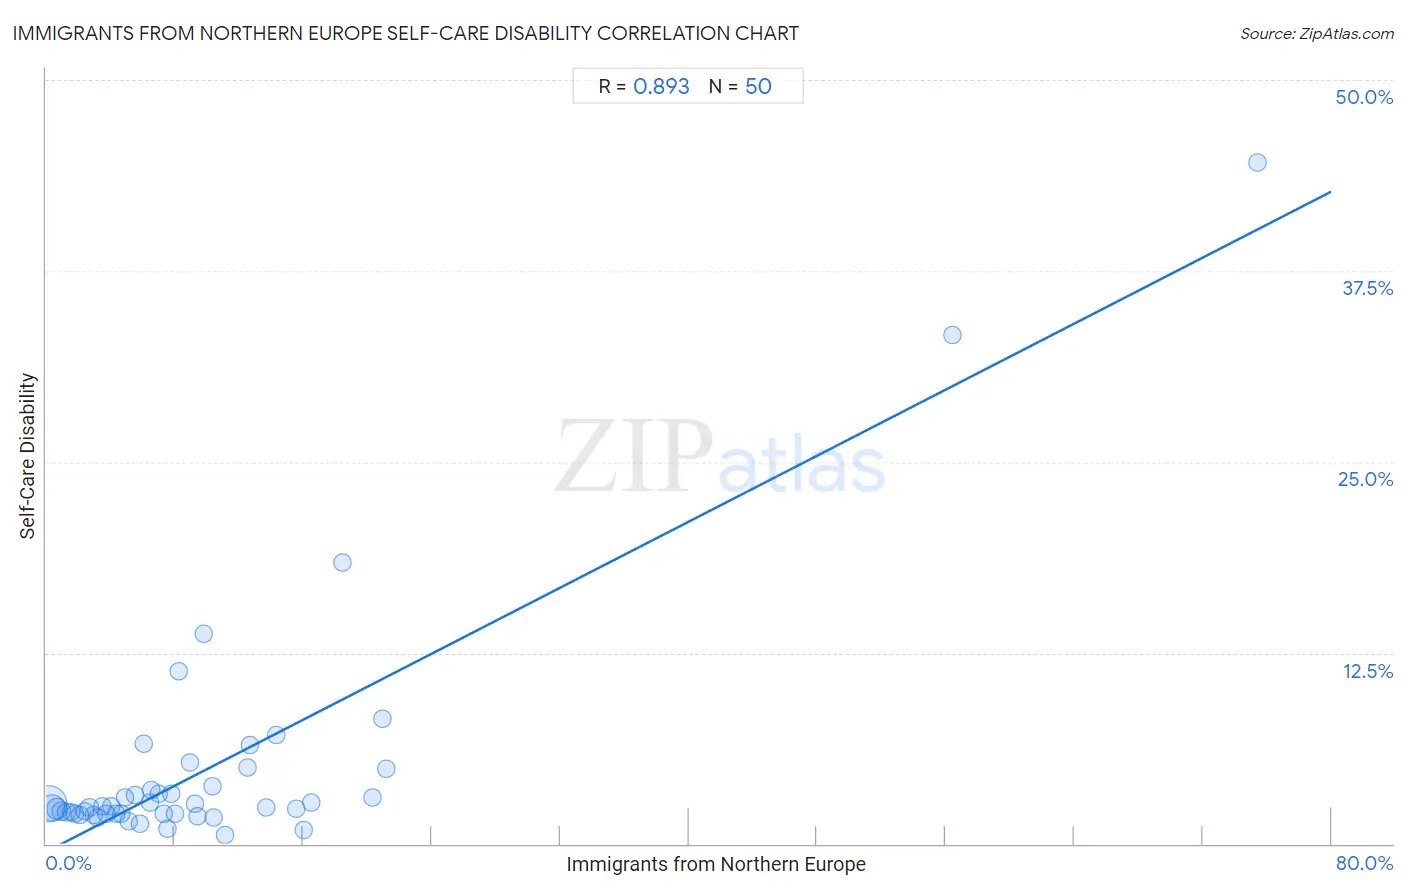
It is essential to understand that the correlation between the percentage of Immigrants from Northern Europe and percentage of population with self-care disability does not imply a direct cause-and-effect relationship. It remains uncertain whether the presence of Immigrants from Northern Europe influences an upward or downward trend in the level of percentage of population with self-care disability within an area, or if Immigrants from Northern Europe simply ended up residing in those areas with higher or lower levels of percentage of population with self-care disability due to other factors.

Demographics Similar to Immigrants from Northern Europe by Self-Care Disability

In terms of self-care disability, the demographic groups most similar to Immigrants from Northern Europe are Immigrants from Zaire (2.3%, a difference of 0.040%), Immigrants from Norway (2.3%, a difference of 0.040%), Asian (2.3%, a difference of 0.040%), Eastern European (2.3%, a difference of 0.070%), and Immigrants from Egypt (2.3%, a difference of 0.090%).
DemographicsRating | RankSelf-Care Disability
Mongolians
99.3
/100
|
#63
Exceptional
2.3%
Swedes
99.3
/100
|
#64
Exceptional
2.3%
Brazilians
99.3
/100
|
#65
Exceptional
2.3%
Immigrants from Argentina
99.3
/100
|
#66
Exceptional
2.3%
South Africans
99.3
/100
|
#67
Exceptional
2.3%
Immigrants from Zaire
99.2
/100
|
#68
Exceptional
2.3%
Immigrants from Norway
99.2
/100
|
#69
Exceptional
2.3%
Immigrants from Northern Europe
99.2
/100
|
#70
Exceptional
2.3%
Asians
99.2
/100
|
#71
Exceptional
2.3%
Eastern Europeans
99.2
/100
|
#72
Exceptional
2.3%
Immigrants from Egypt
99.1
/100
|
#73
Exceptional
2.3%
Immigrants from Switzerland
99.1
/100
|
#74
Exceptional
2.3%
Immigrants from Netherlands
99.1
/100
|
#75
Exceptional
2.3%
Immigrants from China
99.1
/100
|
#76
Exceptional
2.3%
Immigrants from Middle Africa
99.0
/100
|
#77
Exceptional
2.3%

Immigrants from Northern Europe Self-Care Disability Correlation Summary

MeasurementImmigrants from Northern Europe DataSelf-Care Disability Data
Minimum0.13%0.56%
Maximum75.4%44.6%
Range75.3%44.0%
Mean10.2%5.0%
Median7.1%2.4%
Interquartile 25% (IQ1)3.5%2.0%
Interquartile 75% (IQ3)12.5%3.8%
Interquartile Range (IQR)9.0%1.8%
Standard Deviation (Sample)12.9%7.8%
Standard Deviation (Population)12.8%7.7%

Correlation Details

Immigrants from Northern Europe PercentileSample SizeSelf-Care Disability
[
0.0%
-
0.5%
]
0.13%
271,939,6502.6%
[
0.0%
-
0.5%
]
0.40%
115,503,0442.3%
[
0.5%
-
1.0%
]
0.66%
50,566,6742.3%
[
0.5%
-
1.0%
]
0.97%
18,334,2502.1%
[
1.0%
-
1.5%
]
1.26%
8,659,3252.1%
[
1.5%
-
2.0%
]
1.55%
5,084,6442.1%
[
1.5%
-
2.0%
]
1.81%
2,172,0552.0%
[
2.0%
-
2.5%
]
2.08%
1,586,9181.9%
[
2.0%
-
2.5%
]
2.38%
756,6462.1%
[
2.5%
-
3.0%
]
2.68%
468,4182.3%
[
2.5%
-
3.0%
]
2.96%
298,9421.9%
[
3.0%
-
3.5%
]
3.23%
253,9431.7%
[
3.5%
-
4.0%
]
3.52%
201,6862.5%
[
3.5%
-
4.0%
]
3.77%
175,7201.9%
[
4.0%
-
4.5%
]
4.07%
85,3602.4%
[
4.0%
-
4.5%
]
4.34%
73,1242.0%
[
4.5%
-
5.0%
]
4.68%
43,8862.0%
[
4.5%
-
5.0%
]
4.93%
21,7973.0%
[
5.0%
-
5.5%
]
5.16%
21,4131.5%
[
5.0%
-
5.5%
]
5.49%
46,0093.2%
[
5.5%
-
6.0%
]
5.87%
23,4611.3%
[
6.0%
-
6.5%
]
6.06%
1,2876.6%
[
6.0%
-
6.5%
]
6.45%
5,7082.7%
[
6.5%
-
7.0%
]
6.54%
16,9123.5%
[
6.5%
-
7.0%
]
6.97%
11,3083.3%
[
7.0%
-
7.5%
]
7.28%
5,1662.0%
[
7.5%
-
8.0%
]
7.51%
1,3580.96%
[
7.5%
-
8.0%
]
7.77%
2,1893.3%
[
8.0%
-
8.5%
]
8.01%
4,1822.0%
[
8.0%
-
8.5%
]
8.29%
53111.3%
[
8.5%
-
9.0%
]
8.97%
1,4835.3%
[
9.0%
-
9.5%
]
9.26%
8422.6%
[
9.0%
-
9.5%
]
9.40%
3191.8%
[
9.5%
-
10.0%
]
9.80%
15313.7%
[
10.0%
-
10.5%
]
10.38%
1063.8%
[
10.0%
-
10.5%
]
10.45%
7751.7%
[
11.0%
-
11.5%
]
11.14%
2,5400.56%
[
12.0%
-
12.5%
]
12.50%
405.0%
[
12.5%
-
13.0%
]
12.71%
2916.5%
[
13.5%
-
14.0%
]
13.69%
1682.4%
[
14.0%
-
14.5%
]
14.29%
427.1%
[
15.5%
-
16.0%
]
15.53%
9532.3%
[
16.0%
-
16.5%
]
16.07%
3610.87%
[
16.0%
-
16.5%
]
16.50%
4912.7%
[
18.0%
-
18.5%
]
18.42%
3818.4%
[
20.0%
-
20.5%
]
20.30%
1333.0%
[
20.5%
-
21.0%
]
20.90%
2448.2%
[
21.0%
-
21.5%
]
21.19%
4534.9%
[
56.0%
-
56.5%
]
56.39%
32133.3%
[
75.0%
-
75.5%
]
75.42%
24044.6%