Scotch-Irish Female Unemployment

COMPARE

Scotch-Irish
Race
Ancestry
AfghanAfricanAlaska NativeAlaskan AthabascanAlbanianAleutAlsatianAmericanApacheArabArapahoArgentineanArmenianAssyrian/Chaldean/SyriacAustralianAustrianBahamianBangladeshiBarbadianBasqueBelgianBelizeanBermudanBhutaneseBlackfeetBolivianBrazilianBritishBritish West IndianBulgarianBurmeseCajunCambodianCanadianCape VerdeanCarpatho RusynCelticCentral AmericanCentral American IndianCherokeeCheyenneChickasawChileanChineseChippewaChoctawColombianColvilleComancheCosta RicanCreeCreekCroatianCrowCubanCypriotCzechCzechoslovakianDanishDelawareDominicanDutchDutch West IndianEastern EuropeanEcuadorianEgyptianEnglishEstonianEthiopianEuropeanFijianFilipinoFinnishFrenchFrench American IndianFrench CanadianGermanGerman RussianGhanaianGreekGuamanian/ChamorroGuatemalanGuyaneseHaitianHmongHonduranHopiHoumaHungarianIcelanderIndian (Asian)IndonesianInupiatIranianIraqiIrishIroquoisIsraeliItalianJamaicanJapaneseJordanianKenyanKiowaKoreanLaotianLatvianLebaneseLiberianLithuanianLumbeeLuxembourgerMacedonianMalaysianMalteseMarshalleseMenomineeMexicanMexican American IndianMongolianMoroccanNative HawaiianNavajoNepaleseNew ZealanderNicaraguanNigerianNorthern EuropeanNorwegianOkinawanOsageOttawaPaiutePakistaniPalestinianPanamanianParaguayanPennsylvania GermanPeruvianPimaPolishPortuguesePotawatomiPuebloPuerto RicanPuget Sound SalishRomanianRussianSalvadoranSamoanScandinavianScotch-IrishScottishSeminoleSenegaleseSerbianShoshoneSierra LeoneanSiouxSlavicSlovakSloveneSomaliSouth AfricanSouth AmericanSouth American IndianSoviet UnionSpaniardSpanishSpanish AmericanSpanish American IndianSri LankanSubsaharan AfricanSudaneseSwedishSwissSyrianTaiwaneseThaiTlingit-HaidaTohono O'OdhamTonganTrinidadian and TobagonianTsimshianTurkishU.S. Virgin IslanderUgandanUkrainianUruguayanUteVenezuelanVietnameseWelshWest IndianYakamaYaquiYugoslavianYumanYup'ikZimbabwean
Immigration
NonimmigrantsImmigrantsAfghanistanAfricaAlbaniaArgentinaArmeniaAsiaAustraliaAustriaBahamasBangladeshBarbadosBelarusBelgiumBelizeBoliviaBosnia and HerzegovinaBrazilBulgariaBurma/MyanmarCabo VerdeCambodiaCameroonCanadaCaribbeanCentral AmericaChileChinaColombiaCongoCosta RicaCroatiaCubaCzechoslovakiaDenmarkDominicaDominican RepublicEastern AfricaEastern AsiaEastern EuropeEcuadorEgyptEl SalvadorEnglandEritreaEthiopiaEuropeFijiFranceGermanyGhanaGreeceGrenadaGuatemalaGuyanaHaitiHondurasHong KongHungaryIndiaIndonesiaIranIraqIrelandIsraelItalyJamaicaJapanJordanKazakhstanKenyaKoreaKuwaitLaosLatin AmericaLatviaLebanonLiberiaLithuaniaMalaysiaMexicoMicronesiaMiddle AfricaMoldovaMoroccoNepalNetherlandsNicaraguaNigeriaNorth AmericaNorth MacedoniaNorthern AfricaNorthern EuropeNorwayOceaniaPakistanPanamaPeruPhilippinesPolandPortugalRomaniaRussiaSaudi ArabiaScotlandSenegalSerbiaSierra LeoneSingaporeSomaliaSouth AfricaSouth AmericaSouth Central AsiaSouth Eastern AsiaSouthern EuropeSpainSri LankaSt. Vincent and the GrenadinesSudanSwedenSwitzerlandSyriaTaiwanThailandTrinidad and TobagoTurkeyUgandaUkraineUruguayUzbekistanVenezuelaVietnamWest IndiesWestern AfricaWestern AsiaWestern EuropeYemenZaireZimbabweAzores
Select to Compare
Race
Ancestry
AfghanAfricanAlaska NativeAlaskan AthabascanAlbanianAleutAlsatianAmericanApacheArabArapahoArgentineanArmenianAssyrian/Chaldean/SyriacAustralianAustrianBahamianBangladeshiBarbadianBasqueBelgianBelizeanBermudanBhutaneseBlackfeetBolivianBrazilianBritishBritish West IndianBulgarianBurmeseCajunCambodianCanadianCape VerdeanCarpatho RusynCelticCentral AmericanCentral American IndianCherokeeCheyenneChickasawChileanChineseChippewaChoctawColombianColvilleComancheCosta RicanCreeCreekCroatianCrowCubanCypriotCzechCzechoslovakianDanishDelawareDominicanDutchDutch West IndianEastern EuropeanEcuadorianEgyptianEnglishEstonianEthiopianEuropeanFijianFilipinoFinnishFrenchFrench American IndianFrench CanadianGermanGerman RussianGhanaianGreekGuamanian/ChamorroGuatemalanGuyaneseHaitianHmongHonduranHopiHoumaHungarianIcelanderIndian (Asian)IndonesianInupiatIranianIraqiIrishIroquoisIsraeliItalianJamaicanJapaneseJordanianKenyanKiowaKoreanLaotianLatvianLebaneseLiberianLithuanianLumbeeLuxembourgerMacedonianMalaysianMalteseMarshalleseMenomineeMexicanMexican American IndianMongolianMoroccanNative HawaiianNavajoNepaleseNew ZealanderNicaraguanNigerianNorthern EuropeanNorwegianOkinawanOsageOttawaPaiutePakistaniPalestinianPanamanianParaguayanPennsylvania GermanPeruvianPimaPolishPortuguesePotawatomiPuebloPuerto RicanPuget Sound SalishRomanianRussianSalvadoranSamoanScandinavianScottishSeminoleSenegaleseSerbianShoshoneSierra LeoneanSiouxSlavicSlovakSloveneSomaliSouth AfricanSouth AmericanSouth American IndianSoviet UnionSpaniardSpanishSpanish AmericanSpanish American IndianSri LankanSubsaharan AfricanSudaneseSwedishSwissSyrianTaiwaneseThaiTlingit-HaidaTohono O'OdhamTonganTrinidadian and TobagonianTsimshianTurkishU.S. Virgin IslanderUgandanUkrainianUruguayanUteVenezuelanVietnameseWelshWest IndianYakamaYaquiYugoslavianYumanYup'ikZimbabwean
Immigration
NonimmigrantsImmigrantsAfghanistanAfricaAlbaniaArgentinaArmeniaAsiaAustraliaAustriaBahamasBangladeshBarbadosBelarusBelgiumBelizeBoliviaBosnia and HerzegovinaBrazilBulgariaBurma/MyanmarCabo VerdeCambodiaCameroonCanadaCaribbeanCentral AmericaChileChinaColombiaCongoCosta RicaCroatiaCubaCzechoslovakiaDenmarkDominicaDominican RepublicEastern AfricaEastern AsiaEastern EuropeEcuadorEgyptEl SalvadorEnglandEritreaEthiopiaEuropeFijiFranceGermanyGhanaGreeceGrenadaGuatemalaGuyanaHaitiHondurasHong KongHungaryIndiaIndonesiaIranIraqIrelandIsraelItalyJamaicaJapanJordanKazakhstanKenyaKoreaKuwaitLaosLatin AmericaLatviaLebanonLiberiaLithuaniaMalaysiaMexicoMicronesiaMiddle AfricaMoldovaMoroccoNepalNetherlandsNicaraguaNigeriaNorth AmericaNorth MacedoniaNorthern AfricaNorthern EuropeNorwayOceaniaPakistanPanamaPeruPhilippinesPolandPortugalRomaniaRussiaSaudi ArabiaScotlandSenegalSerbiaSierra LeoneSingaporeSomaliaSouth AfricaSouth AmericaSouth Central AsiaSouth Eastern AsiaSouthern EuropeSpainSri LankaSt. Vincent and the GrenadinesSudanSwedenSwitzerlandSyriaTaiwanThailandTrinidad and TobagoTurkeyUgandaUkraineUruguayUzbekistanVenezuelaVietnamWest IndiesWestern AfricaWestern AsiaWestern EuropeYemenZaireZimbabweAzores
Female Unemployment
Income
Poverty
Unemployment
Labor Participation
Family Structure
Vehicle Availability
Education Level
Disability

Scotch-Irish Female Unemployment
Exceptional

4.8%
UNEMPLOYMENT | FEMALES
99.6/ 100
METRIC RATING
39th/ 347
METRIC RANK

Scotch-Irish Female Unemployment Correlation Chart

The statistical analysis conducted on geographies consisting of 537,046,188 people shows a substantial positive correlation between the proportion of Scotch-Irish and unemploymnet rate among females in the United States with a correlation coefficient (R) of 0.596 and weighted average of 4.8%. On average, for every 1% (one percent) increase in Scotch-Irish within a typical geography, there is an increase of 0.74% in unemploymnet rate among females.
Scotch-Irish Female Unemployment
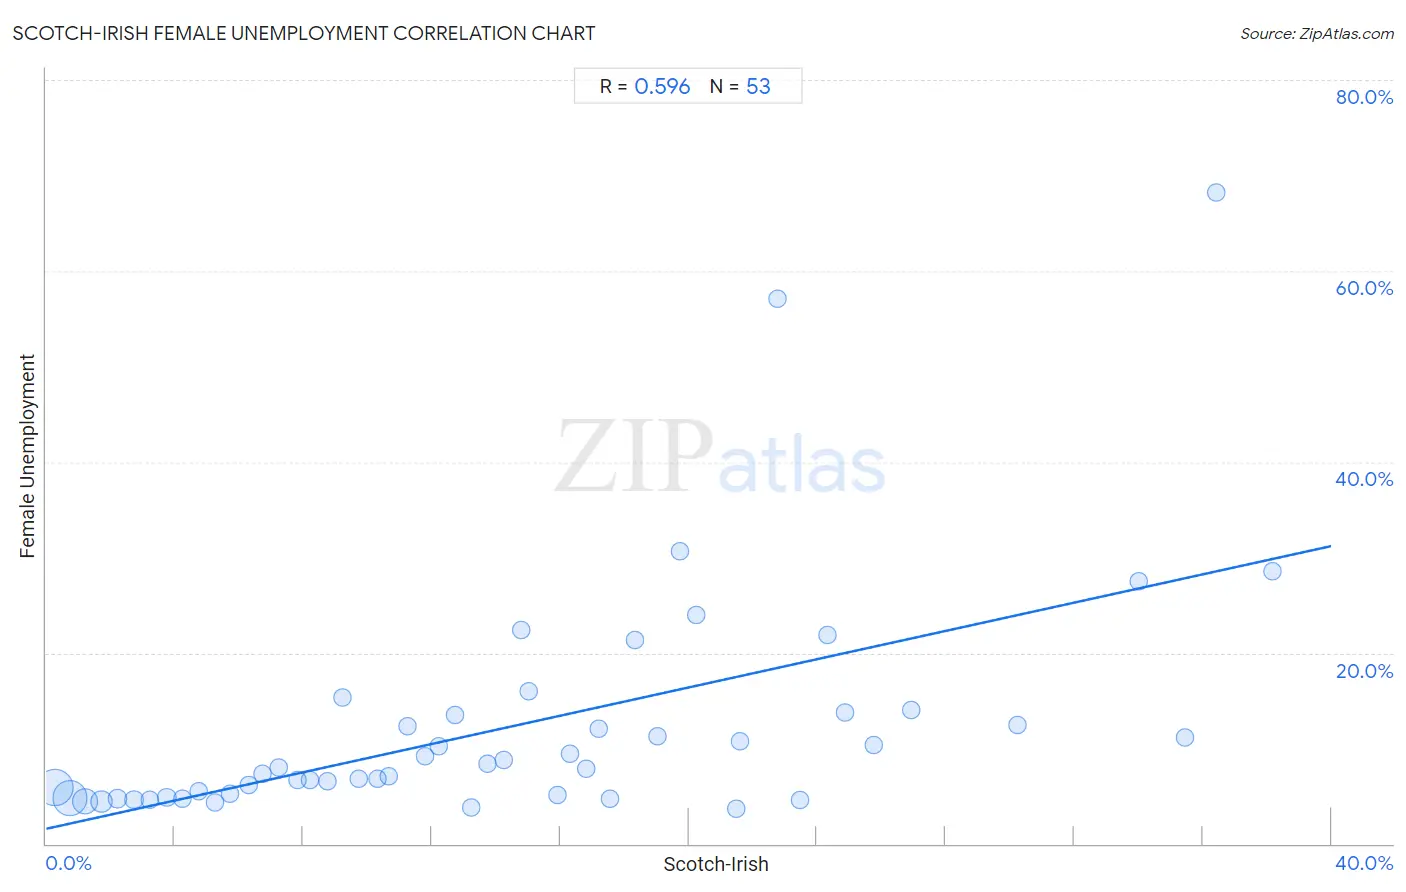
It is essential to understand that the correlation between the percentage of Scotch-Irish and unemploymnet rate among females does not imply a direct cause-and-effect relationship. It remains uncertain whether the presence of Scotch-Irish influences an upward or downward trend in the level of unemploymnet rate among females within an area, or if Scotch-Irish simply ended up residing in those areas with higher or lower levels of unemploymnet rate among females due to other factors.

Demographics Similar to Scotch-Irish by Female Unemployment

In terms of female unemployment, the demographic groups most similar to Scotch-Irish are Northern European (4.8%, a difference of 0.010%), French (4.8%, a difference of 0.040%), Pennsylvania German (4.8%, a difference of 0.12%), Tongan (4.8%, a difference of 0.30%), and Italian (4.8%, a difference of 0.43%).
DemographicsRating | RankFemale Unemployment
Slovaks
99.8
/100
|
#32
Exceptional
4.8%
Czechoslovakians
99.7
/100
|
#33
Exceptional
4.8%
Zimbabweans
99.7
/100
|
#34
Exceptional
4.8%
French Canadians
99.7
/100
|
#35
Exceptional
4.8%
Yugoslavians
99.7
/100
|
#36
Exceptional
4.8%
Pennsylvania Germans
99.6
/100
|
#37
Exceptional
4.8%
Northern Europeans
99.6
/100
|
#38
Exceptional
4.8%
Scotch-Irish
99.6
/100
|
#39
Exceptional
4.8%
French
99.6
/100
|
#40
Exceptional
4.8%
Tongans
99.5
/100
|
#41
Exceptional
4.8%
Italians
99.5
/100
|
#42
Exceptional
4.8%
Eastern Europeans
99.4
/100
|
#43
Exceptional
4.9%
Greeks
99.4
/100
|
#44
Exceptional
4.9%
Austrians
99.3
/100
|
#45
Exceptional
4.9%
Immigrants from Bulgaria
99.3
/100
|
#46
Exceptional
4.9%

Scotch-Irish Female Unemployment Correlation Summary

MeasurementScotch-Irish DataFemale Unemployment Data
Minimum0.25%3.7%
Maximum38.2%68.2%
Range37.9%64.5%
Mean14.5%12.3%
Median13.2%8.0%
Interquartile 25% (IQ1)6.5%5.0%
Interquartile 75% (IQ3)20.8%13.6%
Interquartile Range (IQR)14.3%8.7%
Standard Deviation (Sample)9.8%12.2%
Standard Deviation (Population)9.7%12.1%

Correlation Details

Scotch-Irish PercentileSample SizeFemale Unemployment
[
0.0%
-
0.5%
]
0.25%
207,443,9655.9%
[
0.5%
-
1.0%
]
0.72%
180,475,5134.8%
[
1.0%
-
1.5%
]
1.21%
80,980,3104.4%
[
1.5%
-
2.0%
]
1.71%
35,410,6724.4%
[
2.0%
-
2.5%
]
2.21%
15,186,9104.7%
[
2.5%
-
3.0%
]
2.73%
7,334,2874.6%
[
3.0%
-
3.5%
]
3.23%
4,800,0684.6%
[
3.5%
-
4.0%
]
3.75%
2,228,7304.9%
[
4.0%
-
4.5%
]
4.25%
1,117,2214.7%
[
4.5%
-
5.0%
]
4.76%
610,5385.6%
[
5.0%
-
5.5%
]
5.24%
530,3354.3%
[
5.5%
-
6.0%
]
5.72%
250,0535.2%
[
6.0%
-
6.5%
]
6.31%
142,0426.2%
[
6.5%
-
7.0%
]
6.72%
99,5247.4%
[
7.0%
-
7.5%
]
7.23%
83,3078.0%
[
7.5%
-
8.0%
]
7.81%
77,9016.7%
[
8.0%
-
8.5%
]
8.21%
48,5976.7%
[
8.5%
-
9.0%
]
8.74%
43,4796.5%
[
9.0%
-
9.5%
]
9.22%
26,69915.3%
[
9.5%
-
10.0%
]
9.74%
25,6036.8%
[
10.0%
-
10.5%
]
10.31%
26,0396.8%
[
10.5%
-
11.0%
]
10.68%
14,4167.1%
[
11.0%
-
11.5%
]
11.23%
9,94112.3%
[
11.5%
-
12.0%
]
11.81%
3,8629.1%
[
12.0%
-
12.5%
]
12.23%
5,65710.2%
[
12.5%
-
13.0%
]
12.74%
2,53513.5%
[
13.0%
-
13.5%
]
13.22%
14,0623.8%
[
13.5%
-
14.0%
]
13.72%
5,9538.4%
[
14.0%
-
14.5%
]
14.24%
12,2438.7%
[
14.5%
-
15.0%
]
14.79%
56822.4%
[
15.0%
-
15.5%
]
15.03%
2,54116.0%
[
15.5%
-
16.0%
]
15.90%
3,2025.1%
[
16.0%
-
16.5%
]
16.29%
4,5249.5%
[
16.5%
-
17.0%
]
16.81%
4,7767.9%
[
17.0%
-
17.5%
]
17.22%
4,39112.0%
[
17.5%
-
18.0%
]
17.56%
4,5734.7%
[
18.0%
-
18.5%
]
18.32%
1,86721.3%
[
19.0%
-
19.5%
]
19.03%
55711.2%
[
19.5%
-
20.0%
]
19.71%
97430.7%
[
20.0%
-
20.5%
]
20.22%
45524.0%
[
21.0%
-
21.5%
]
21.47%
3683.7%
[
21.5%
-
22.0%
]
21.61%
19910.8%
[
22.5%
-
23.0%
]
22.77%
20257.1%
[
23.0%
-
23.5%
]
23.48%
9034.6%
[
24.0%
-
24.5%
]
24.30%
25121.8%
[
24.5%
-
25.0%
]
24.88%
1,68813.8%
[
25.5%
-
26.0%
]
25.77%
16310.3%
[
26.5%
-
27.0%
]
26.92%
36414.0%
[
30.0%
-
30.5%
]
30.23%
1,83912.4%
[
34.0%
-
34.5%
]
34.01%
39727.5%
[
35.0%
-
35.5%
]
35.46%
14111.1%
[
36.0%
-
36.5%
]
36.40%
72868.2%
[
38.0%
-
38.5%
]
38.18%
5528.6%