Scotch-Irish Single Female Poverty
COMPARE
Scotch-Irish
Select to Compare
Single Female Poverty
Scotch-Irish Single Female Poverty
22.9%
POVERTY | SINGLE FEMALES
0.3/ 100
METRIC RATING
263rd/ 347
METRIC RANK
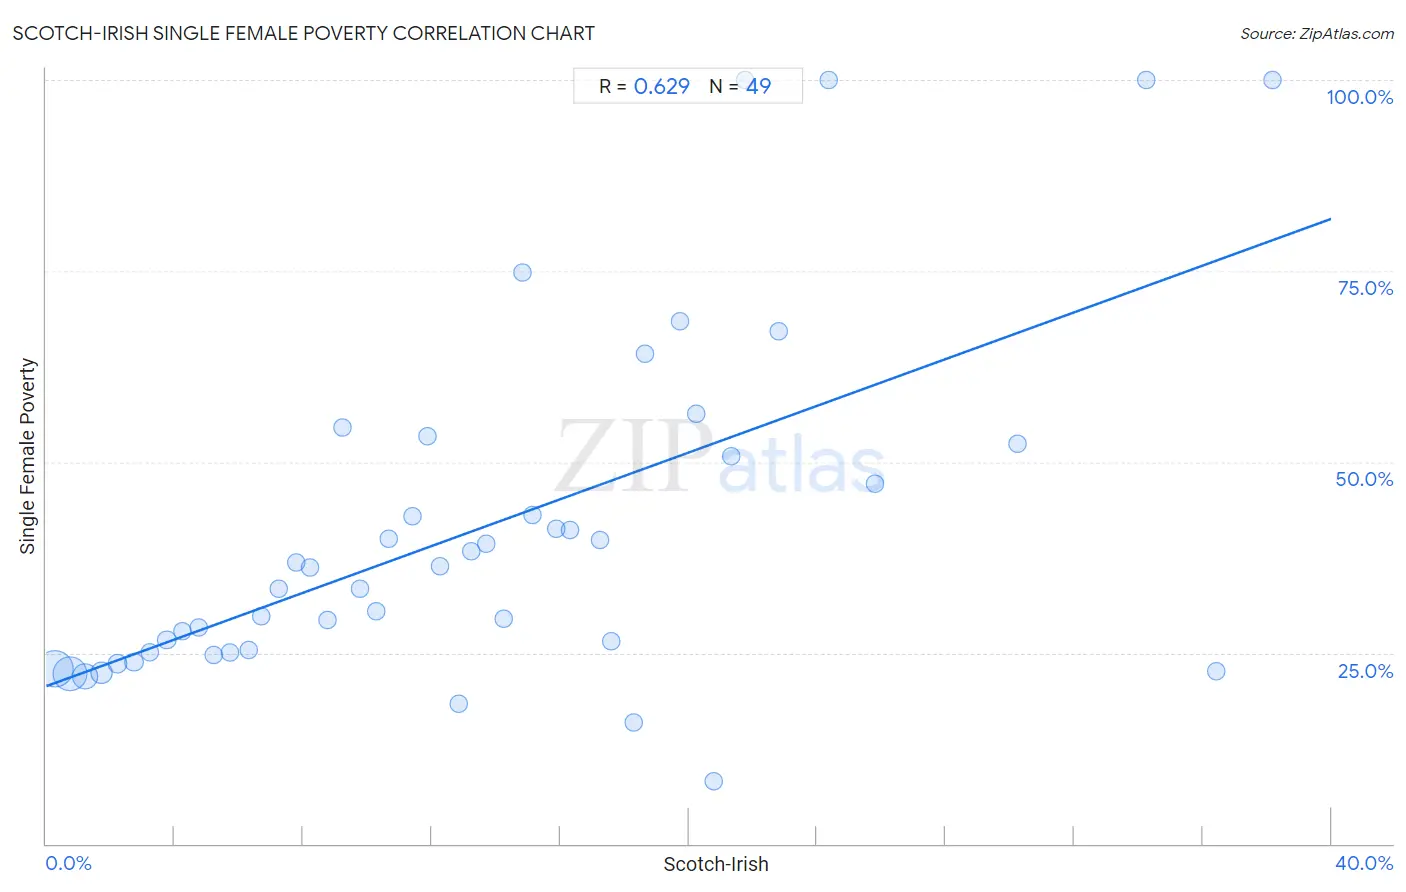
Scotch-Irish Single Female Poverty Correlation Chart
The statistical analysis conducted on geographies consisting of 531,342,644 people shows a significant positive correlation between the proportion of Scotch-Irish and poverty level among single females in the United States with a correlation coefficient (R) of 0.629 and weighted average of 22.9%. On average, for every 1% (one percent) increase in Scotch-Irish within a typical geography, there is an increase of 1.5% in poverty level among single females.
It is essential to understand that the correlation between the percentage of Scotch-Irish and poverty level among single females does not imply a direct cause-and-effect relationship. It remains uncertain whether the presence of Scotch-Irish influences an upward or downward trend in the level of poverty level among single females within an area, or if Scotch-Irish simply ended up residing in those areas with higher or lower levels of poverty level among single females due to other factors.
Demographics Similar to Scotch-Irish by Single Female Poverty
In terms of single female poverty, the demographic groups most similar to Scotch-Irish are Immigrants from Laos (22.9%, a difference of 0.070%), Central American (23.0%, a difference of 0.24%), British West Indian (22.8%, a difference of 0.41%), Immigrants from Micronesia (23.0%, a difference of 0.45%), and Senegalese (23.0%, a difference of 0.51%).
| Demographics | Rating | Rank | Single Female Poverty |
| Immigrants from Belize | 0.8 /100 | #256 | Tragic 22.6% |
| Sudanese | 0.7 /100 | #257 | Tragic 22.6% |
| Bahamians | 0.6 /100 | #258 | Tragic 22.7% |
| Whites/Caucasians | 0.6 /100 | #259 | Tragic 22.7% |
| Celtics | 0.5 /100 | #260 | Tragic 22.7% |
| Immigrants from Cabo Verde | 0.4 /100 | #261 | Tragic 22.8% |
| British West Indians | 0.4 /100 | #262 | Tragic 22.8% |
| Scotch-Irish | 0.3 /100 | #263 | Tragic 22.9% |
| Immigrants from Laos | 0.3 /100 | #264 | Tragic 22.9% |
| Central Americans | 0.2 /100 | #265 | Tragic 23.0% |
| Immigrants from Micronesia | 0.2 /100 | #266 | Tragic 23.0% |
| Senegalese | 0.2 /100 | #267 | Tragic 23.0% |
| Fijians | 0.2 /100 | #268 | Tragic 23.1% |
| Hmong | 0.2 /100 | #269 | Tragic 23.1% |
| Inupiat | 0.2 /100 | #270 | Tragic 23.1% |
Scotch-Irish Single Female Poverty Correlation Summary
| Measurement | Scotch-Irish Data | Single Female Poverty Data |
| Minimum | 0.25% | 8.1% |
| Maximum | 38.2% | 100.0% |
| Range | 37.9% | 91.9% |
| Mean | 13.5% | 41.2% |
| Median | 12.2% | 36.1% |
| Interquartile 25% (IQ1) | 6.0% | 25.0% |
| Interquartile 75% (IQ3) | 19.2% | 51.6% |
| Interquartile Range (IQR) | 13.2% | 26.6% |
| Standard Deviation (Sample) | 9.4% | 22.8% |
| Standard Deviation (Population) | 9.3% | 22.5% |
Correlation Details
| Scotch-Irish Percentile | Sample Size | Single Female Poverty |
[ 0.0% - 0.5% ] 0.25% | 205,993,620 | 23.0% |
[ 0.5% - 1.0% ] 0.72% | 178,398,152 | 22.2% |
[ 1.0% - 1.5% ] 1.21% | 79,796,248 | 22.0% |
[ 1.5% - 2.0% ] 1.71% | 34,802,444 | 22.4% |
[ 2.0% - 2.5% ] 2.21% | 14,966,479 | 23.6% |
[ 2.5% - 3.0% ] 2.73% | 7,228,489 | 23.8% |
[ 3.0% - 3.5% ] 3.23% | 4,676,737 | 25.0% |
[ 3.5% - 4.0% ] 3.75% | 2,202,933 | 26.7% |
[ 4.0% - 4.5% ] 4.25% | 1,113,971 | 27.8% |
[ 4.5% - 5.0% ] 4.75% | 622,315 | 28.3% |
[ 5.0% - 5.5% ] 5.23% | 562,058 | 24.8% |
[ 5.5% - 6.0% ] 5.72% | 268,637 | 25.0% |
[ 6.0% - 6.5% ] 6.30% | 164,110 | 25.4% |
[ 6.5% - 7.0% ] 6.70% | 97,835 | 29.8% |
[ 7.0% - 7.5% ] 7.22% | 84,796 | 33.5% |
[ 7.5% - 8.0% ] 7.80% | 83,845 | 36.8% |
[ 8.0% - 8.5% ] 8.20% | 48,812 | 36.1% |
[ 8.5% - 9.0% ] 8.74% | 42,069 | 29.3% |
[ 9.0% - 9.5% ] 9.23% | 23,368 | 54.6% |
[ 9.5% - 10.0% ] 9.76% | 23,228 | 33.4% |
[ 10.0% - 10.5% ] 10.29% | 28,086 | 30.4% |
[ 10.5% - 11.0% ] 10.67% | 14,760 | 39.9% |
[ 11.0% - 11.5% ] 11.39% | 6,856 | 42.9% |
[ 11.5% - 12.0% ] 11.85% | 8,867 | 53.3% |
[ 12.0% - 12.5% ] 12.25% | 3,633 | 36.3% |
[ 12.5% - 13.0% ] 12.83% | 1,060 | 18.4% |
[ 13.0% - 13.5% ] 13.22% | 17,451 | 38.3% |
[ 13.5% - 14.0% ] 13.71% | 13,049 | 39.2% |
[ 14.0% - 14.5% ] 14.25% | 13,032 | 29.5% |
[ 14.5% - 15.0% ] 14.84% | 1,274 | 74.8% |
[ 15.0% - 15.5% ] 15.12% | 3,029 | 43.1% |
[ 15.5% - 16.0% ] 15.87% | 4,278 | 41.2% |
[ 16.0% - 16.5% ] 16.29% | 2,904 | 41.1% |
[ 17.0% - 17.5% ] 17.24% | 4,750 | 39.8% |
[ 17.5% - 18.0% ] 17.60% | 6,323 | 26.5% |
[ 18.0% - 18.5% ] 18.30% | 1,628 | 15.9% |
[ 18.5% - 19.0% ] 18.65% | 2,917 | 64.2% |
[ 19.5% - 20.0% ] 19.71% | 974 | 68.4% |
[ 20.0% - 20.5% ] 20.24% | 252 | 56.3% |
[ 20.5% - 21.0% ] 20.77% | 1,271 | 8.1% |
[ 21.0% - 21.5% ] 21.34% | 731 | 50.8% |
[ 21.5% - 22.0% ] 21.76% | 740 | 100.0% |
[ 22.5% - 23.0% ] 22.81% | 228 | 67.1% |
[ 24.0% - 24.5% ] 24.34% | 189 | 100.0% |
[ 25.5% - 26.0% ] 25.80% | 407 | 47.1% |
[ 30.0% - 30.5% ] 30.24% | 2,576 | 52.4% |
[ 34.0% - 34.5% ] 34.22% | 450 | 100.0% |
[ 36.0% - 36.5% ] 36.40% | 728 | 22.6% |
[ 38.0% - 38.5% ] 38.18% | 55 | 100.0% |