Scotch-Irish Male Unemployment

COMPARE

Scotch-Irish
Race
Ancestry
AfghanAfricanAlaska NativeAlaskan AthabascanAlbanianAleutAlsatianAmericanApacheArabArapahoArgentineanArmenianAssyrian/Chaldean/SyriacAustralianAustrianBahamianBangladeshiBarbadianBasqueBelgianBelizeanBermudanBhutaneseBlackfeetBolivianBrazilianBritishBritish West IndianBulgarianBurmeseCajunCambodianCanadianCape VerdeanCarpatho RusynCelticCentral AmericanCentral American IndianCherokeeCheyenneChickasawChileanChineseChippewaChoctawColombianColvilleComancheCosta RicanCreeCreekCroatianCrowCubanCypriotCzechCzechoslovakianDanishDelawareDominicanDutchDutch West IndianEastern EuropeanEcuadorianEgyptianEnglishEstonianEthiopianEuropeanFijianFilipinoFinnishFrenchFrench American IndianFrench CanadianGermanGerman RussianGhanaianGreekGuamanian/ChamorroGuatemalanGuyaneseHaitianHmongHonduranHopiHoumaHungarianIcelanderIndian (Asian)IndonesianInupiatIranianIraqiIrishIroquoisIsraeliItalianJamaicanJapaneseJordanianKenyanKiowaKoreanLaotianLatvianLebaneseLiberianLithuanianLumbeeLuxembourgerMacedonianMalaysianMalteseMarshalleseMenomineeMexicanMexican American IndianMongolianMoroccanNative HawaiianNavajoNepaleseNew ZealanderNicaraguanNigerianNorthern EuropeanNorwegianOkinawanOsageOttawaPaiutePakistaniPalestinianPanamanianParaguayanPennsylvania GermanPeruvianPimaPolishPortuguesePotawatomiPuebloPuerto RicanPuget Sound SalishRomanianRussianSalvadoranSamoanScandinavianScotch-IrishScottishSeminoleSenegaleseSerbianShoshoneSierra LeoneanSiouxSlavicSlovakSloveneSomaliSouth AfricanSouth AmericanSouth American IndianSoviet UnionSpaniardSpanishSpanish AmericanSpanish American IndianSri LankanSubsaharan AfricanSudaneseSwedishSwissSyrianTaiwaneseThaiTlingit-HaidaTohono O'OdhamTonganTrinidadian and TobagonianTsimshianTurkishU.S. Virgin IslanderUgandanUkrainianUruguayanUteVenezuelanVietnameseWelshWest IndianYakamaYaquiYugoslavianYumanYup'ikZimbabwean
Immigration
NonimmigrantsImmigrantsAfghanistanAfricaAlbaniaArgentinaArmeniaAsiaAustraliaAustriaBahamasBangladeshBarbadosBelarusBelgiumBelizeBoliviaBosnia and HerzegovinaBrazilBulgariaBurma/MyanmarCabo VerdeCambodiaCameroonCanadaCaribbeanCentral AmericaChileChinaColombiaCongoCosta RicaCroatiaCubaCzechoslovakiaDenmarkDominicaDominican RepublicEastern AfricaEastern AsiaEastern EuropeEcuadorEgyptEl SalvadorEnglandEritreaEthiopiaEuropeFijiFranceGermanyGhanaGreeceGrenadaGuatemalaGuyanaHaitiHondurasHong KongHungaryIndiaIndonesiaIranIraqIrelandIsraelItalyJamaicaJapanJordanKazakhstanKenyaKoreaKuwaitLaosLatin AmericaLatviaLebanonLiberiaLithuaniaMalaysiaMexicoMicronesiaMiddle AfricaMoldovaMoroccoNepalNetherlandsNicaraguaNigeriaNorth AmericaNorth MacedoniaNorthern AfricaNorthern EuropeNorwayOceaniaPakistanPanamaPeruPhilippinesPolandPortugalRomaniaRussiaSaudi ArabiaScotlandSenegalSerbiaSierra LeoneSingaporeSomaliaSouth AfricaSouth AmericaSouth Central AsiaSouth Eastern AsiaSouthern EuropeSpainSri LankaSt. Vincent and the GrenadinesSudanSwedenSwitzerlandSyriaTaiwanThailandTrinidad and TobagoTurkeyUgandaUkraineUruguayUzbekistanVenezuelaVietnamWest IndiesWestern AfricaWestern AsiaWestern EuropeYemenZaireZimbabweAzores
Select to Compare
Race
Ancestry
AfghanAfricanAlaska NativeAlaskan AthabascanAlbanianAleutAlsatianAmericanApacheArabArapahoArgentineanArmenianAssyrian/Chaldean/SyriacAustralianAustrianBahamianBangladeshiBarbadianBasqueBelgianBelizeanBermudanBhutaneseBlackfeetBolivianBrazilianBritishBritish West IndianBulgarianBurmeseCajunCambodianCanadianCape VerdeanCarpatho RusynCelticCentral AmericanCentral American IndianCherokeeCheyenneChickasawChileanChineseChippewaChoctawColombianColvilleComancheCosta RicanCreeCreekCroatianCrowCubanCypriotCzechCzechoslovakianDanishDelawareDominicanDutchDutch West IndianEastern EuropeanEcuadorianEgyptianEnglishEstonianEthiopianEuropeanFijianFilipinoFinnishFrenchFrench American IndianFrench CanadianGermanGerman RussianGhanaianGreekGuamanian/ChamorroGuatemalanGuyaneseHaitianHmongHonduranHopiHoumaHungarianIcelanderIndian (Asian)IndonesianInupiatIranianIraqiIrishIroquoisIsraeliItalianJamaicanJapaneseJordanianKenyanKiowaKoreanLaotianLatvianLebaneseLiberianLithuanianLumbeeLuxembourgerMacedonianMalaysianMalteseMarshalleseMenomineeMexicanMexican American IndianMongolianMoroccanNative HawaiianNavajoNepaleseNew ZealanderNicaraguanNigerianNorthern EuropeanNorwegianOkinawanOsageOttawaPaiutePakistaniPalestinianPanamanianParaguayanPennsylvania GermanPeruvianPimaPolishPortuguesePotawatomiPuebloPuerto RicanPuget Sound SalishRomanianRussianSalvadoranSamoanScandinavianScottishSeminoleSenegaleseSerbianShoshoneSierra LeoneanSiouxSlavicSlovakSloveneSomaliSouth AfricanSouth AmericanSouth American IndianSoviet UnionSpaniardSpanishSpanish AmericanSpanish American IndianSri LankanSubsaharan AfricanSudaneseSwedishSwissSyrianTaiwaneseThaiTlingit-HaidaTohono O'OdhamTonganTrinidadian and TobagonianTsimshianTurkishU.S. Virgin IslanderUgandanUkrainianUruguayanUteVenezuelanVietnameseWelshWest IndianYakamaYaquiYugoslavianYumanYup'ikZimbabwean
Immigration
NonimmigrantsImmigrantsAfghanistanAfricaAlbaniaArgentinaArmeniaAsiaAustraliaAustriaBahamasBangladeshBarbadosBelarusBelgiumBelizeBoliviaBosnia and HerzegovinaBrazilBulgariaBurma/MyanmarCabo VerdeCambodiaCameroonCanadaCaribbeanCentral AmericaChileChinaColombiaCongoCosta RicaCroatiaCubaCzechoslovakiaDenmarkDominicaDominican RepublicEastern AfricaEastern AsiaEastern EuropeEcuadorEgyptEl SalvadorEnglandEritreaEthiopiaEuropeFijiFranceGermanyGhanaGreeceGrenadaGuatemalaGuyanaHaitiHondurasHong KongHungaryIndiaIndonesiaIranIraqIrelandIsraelItalyJamaicaJapanJordanKazakhstanKenyaKoreaKuwaitLaosLatin AmericaLatviaLebanonLiberiaLithuaniaMalaysiaMexicoMicronesiaMiddle AfricaMoldovaMoroccoNepalNetherlandsNicaraguaNigeriaNorth AmericaNorth MacedoniaNorthern AfricaNorthern EuropeNorwayOceaniaPakistanPanamaPeruPhilippinesPolandPortugalRomaniaRussiaSaudi ArabiaScotlandSenegalSerbiaSierra LeoneSingaporeSomaliaSouth AfricaSouth AmericaSouth Central AsiaSouth Eastern AsiaSouthern EuropeSpainSri LankaSt. Vincent and the GrenadinesSudanSwedenSwitzerlandSyriaTaiwanThailandTrinidad and TobagoTurkeyUgandaUkraineUruguayUzbekistanVenezuelaVietnamWest IndiesWestern AfricaWestern AsiaWestern EuropeYemenZaireZimbabweAzores
Male Unemployment
Income
Poverty
Unemployment
Labor Participation
Family Structure
Vehicle Availability
Education Level
Disability

Scotch-Irish Male Unemployment
Exceptional

4.9%
UNEMPLOYMENT | MALES
99.4/ 100
METRIC RATING
37th/ 347
METRIC RANK

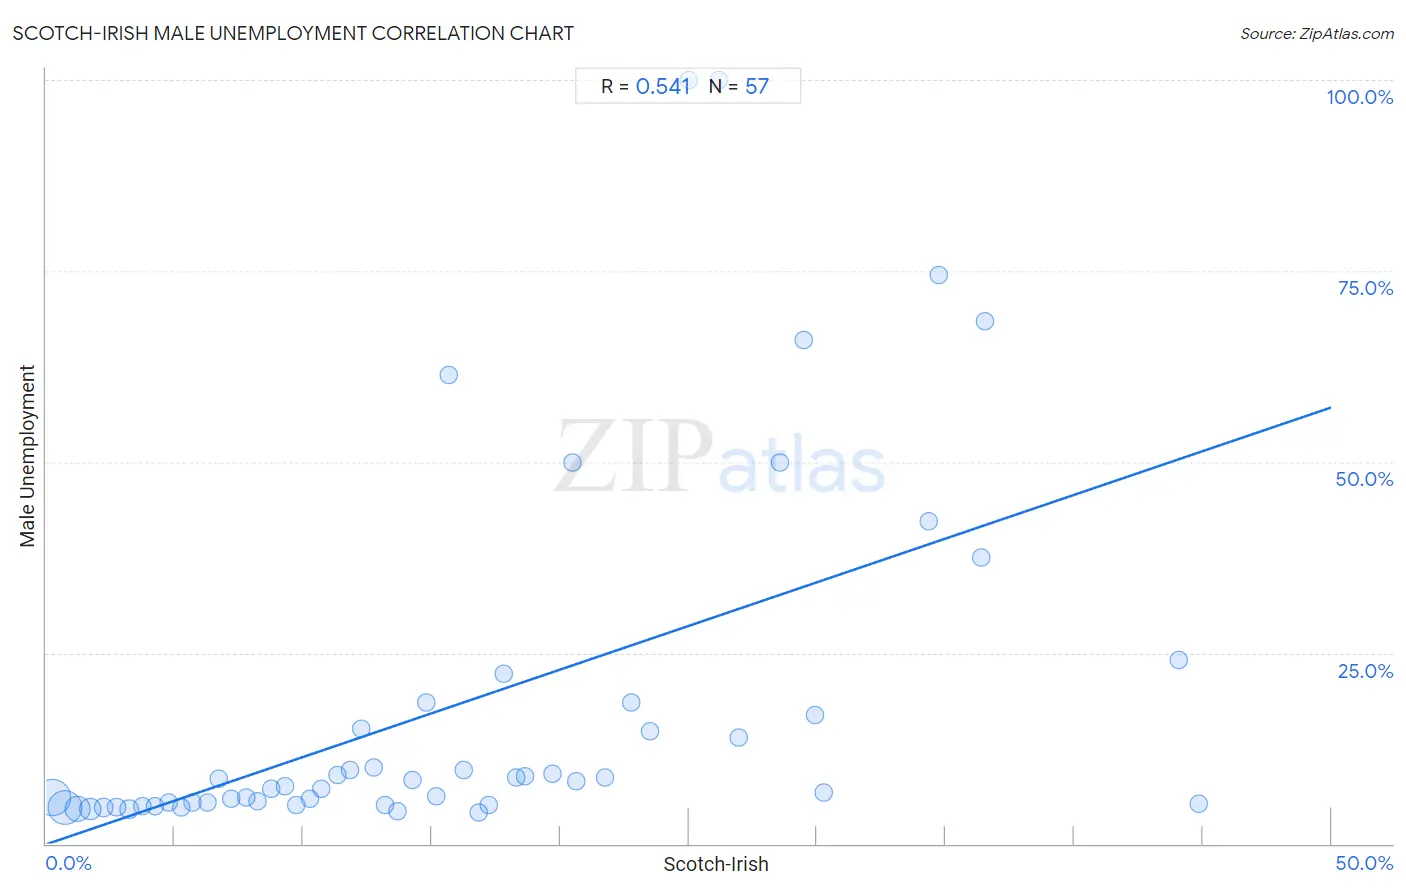
Scotch-Irish Male Unemployment Correlation Chart

The statistical analysis conducted on geographies consisting of 539,618,671 people shows a substantial positive correlation between the proportion of Scotch-Irish and unemployment rate among males in the United States with a correlation coefficient (R) of 0.541 and weighted average of 4.9%. On average, for every 1% (one percent) increase in Scotch-Irish within a typical geography, there is an increase of 1.1% in unemployment rate among males.
Scotch-Irish Male Unemployment
It is essential to understand that the correlation between the percentage of Scotch-Irish and unemployment rate among males does not imply a direct cause-and-effect relationship. It remains uncertain whether the presence of Scotch-Irish influences an upward or downward trend in the level of unemployment rate among males within an area, or if Scotch-Irish simply ended up residing in those areas with higher or lower levels of unemployment rate among males due to other factors.

Demographics Similar to Scotch-Irish by Male Unemployment

In terms of male unemployment, the demographic groups most similar to Scotch-Irish are Immigrants from Bosnia and Herzegovina (4.9%, a difference of 0.020%), Burmese (4.9%, a difference of 0.090%), Northern European (4.9%, a difference of 0.17%), Immigrants from Singapore (4.9%, a difference of 0.21%), and Chinese (4.9%, a difference of 0.26%).
DemographicsRating | RankMale Unemployment
British
99.8
/100
|
#30
Exceptional
4.8%
Sudanese
99.8
/100
|
#31
Exceptional
4.8%
Immigrants from Nepal
99.8
/100
|
#32
Exceptional
4.8%
Latvians
99.7
/100
|
#33
Exceptional
4.8%
Welsh
99.7
/100
|
#34
Exceptional
4.8%
Paraguayans
99.5
/100
|
#35
Exceptional
4.9%
Immigrants from Singapore
99.4
/100
|
#36
Exceptional
4.9%
Scotch-Irish
99.4
/100
|
#37
Exceptional
4.9%
Immigrants from Bosnia and Herzegovina
99.4
/100
|
#38
Exceptional
4.9%
Burmese
99.3
/100
|
#39
Exceptional
4.9%
Northern Europeans
99.3
/100
|
#40
Exceptional
4.9%
Chinese
99.3
/100
|
#41
Exceptional
4.9%
Immigrants from Belgium
99.2
/100
|
#42
Exceptional
4.9%
Immigrants from Japan
99.2
/100
|
#43
Exceptional
4.9%
Immigrants from Korea
99.1
/100
|
#44
Exceptional
4.9%

Scotch-Irish Male Unemployment Correlation Summary

MeasurementScotch-Irish DataMale Unemployment Data
Minimum0.25%4.1%
Maximum44.8%100.0%
Range44.6%95.9%
Mean16.1%18.3%
Median14.3%8.2%
Interquartile 25% (IQ1)7.0%5.2%
Interquartile 75% (IQ3)23.1%17.7%
Interquartile Range (IQR)16.1%12.5%
Standard Deviation (Sample)11.3%23.8%
Standard Deviation (Population)11.2%23.6%

Correlation Details

Scotch-Irish PercentileSample SizeMale Unemployment
[
0.0%
-
0.5%
]
0.25%
208,540,9206.1%
[
0.5%
-
1.0%
]
0.72%
180,898,8044.8%
[
1.0%
-
1.5%
]
1.21%
81,319,6504.6%
[
1.5%
-
2.0%
]
1.71%
35,653,9904.5%
[
2.0%
-
2.5%
]
2.21%
15,346,7734.7%
[
2.5%
-
3.0%
]
2.73%
7,407,1434.8%
[
3.0%
-
3.5%
]
3.23%
4,794,4804.5%
[
3.5%
-
4.0%
]
3.75%
2,275,6584.9%
[
4.0%
-
4.5%
]
4.25%
1,153,1904.9%
[
4.5%
-
5.0%
]
4.76%
654,4745.4%
[
5.0%
-
5.5%
]
5.23%
570,5214.8%
[
5.5%
-
6.0%
]
5.71%
270,5225.5%
[
6.0%
-
6.5%
]
6.29%
157,1325.4%
[
6.5%
-
7.0%
]
6.71%
112,9818.6%
[
7.0%
-
7.5%
]
7.22%
83,5855.9%
[
7.5%
-
8.0%
]
7.79%
86,0196.1%
[
8.0%
-
8.5%
]
8.21%
48,4925.6%
[
8.5%
-
9.0%
]
8.74%
42,3657.2%
[
9.0%
-
9.5%
]
9.28%
23,7517.6%
[
9.5%
-
10.0%
]
9.75%
31,1735.1%
[
10.0%
-
10.5%
]
10.26%
24,4585.9%
[
10.5%
-
11.0%
]
10.71%
17,0777.2%
[
11.0%
-
11.5%
]
11.32%
9,6839.0%
[
11.5%
-
12.0%
]
11.83%
7,4149.6%
[
12.0%
-
12.5%
]
12.23%
6,59615.0%
[
12.5%
-
13.0%
]
12.74%
3,5099.9%
[
13.0%
-
13.5%
]
13.20%
10,3755.0%
[
13.5%
-
14.0%
]
13.69%
12,8704.2%
[
14.0%
-
14.5%
]
14.26%
14,1918.4%
[
14.5%
-
15.0%
]
14.81%
1,91818.6%
[
15.0%
-
15.5%
]
15.15%
3,9536.2%
[
15.5%
-
16.0%
]
15.65%
37761.4%
[
16.0%
-
16.5%
]
16.25%
8,0149.7%
[
16.5%
-
17.0%
]
16.81%
4,6524.1%
[
17.0%
-
17.5%
]
17.22%
3,3975.1%
[
17.5%
-
18.0%
]
17.79%
3,40722.2%
[
18.0%
-
18.5%
]
18.30%
1,6288.6%
[
18.5%
-
19.0%
]
18.64%
1,7498.9%
[
19.5%
-
20.0%
]
19.72%
1,1369.2%
[
20.0%
-
20.5%
]
20.45%
4450.0%
[
20.5%
-
21.0%
]
20.63%
9898.2%
[
21.5%
-
22.0%
]
21.72%
1,3958.6%
[
22.5%
-
23.0%
]
22.75%
1,27518.4%
[
23.0%
-
23.5%
]
23.48%
90314.7%
[
25.0%
-
25.5%
]
25.00%
56100.0%
[
26.0%
-
26.5%
]
26.16%
237100.0%
[
26.5%
-
27.0%
]
26.92%
36413.9%
[
28.5%
-
29.0%
]
28.57%
11250.0%
[
29.0%
-
29.5%
]
29.49%
21766.0%
[
29.5%
-
30.0%
]
29.91%
66216.9%
[
30.0%
-
30.5%
]
30.23%
1,8396.7%
[
34.0%
-
34.5%
]
34.33%
23342.3%
[
34.5%
-
35.0%
]
34.74%
30874.4%
[
36.0%
-
36.5%
]
36.40%
72837.5%
[
36.5%
-
37.0%
]
36.53%
60568.3%
[
44.0%
-
44.5%
]
44.08%
33824.0%
[
44.5%
-
45.0%
]
44.84%
3395.2%