Yugoslavian Self-Care Disability
COMPARE
Yugoslavian
Select to Compare
Self-Care Disability
Yugoslavian Self-Care Disability
2.5%
SELF-CARE DISABILITY
36.1/ 100
METRIC RATING
184th/ 347
METRIC RANK
Yugoslavian Self-Care Disability Correlation Chart
The statistical analysis conducted on geographies consisting of 285,516,060 people shows a slight positive correlation between the proportion of Yugoslavians and percentage of population with self-care disability in the United States with a correlation coefficient (R) of 0.087 and weighted average of 2.5%. On average, for every 1% (one percent) increase in Yugoslavians within a typical geography, there is an increase of 0.033% in percentage of population with self-care disability.
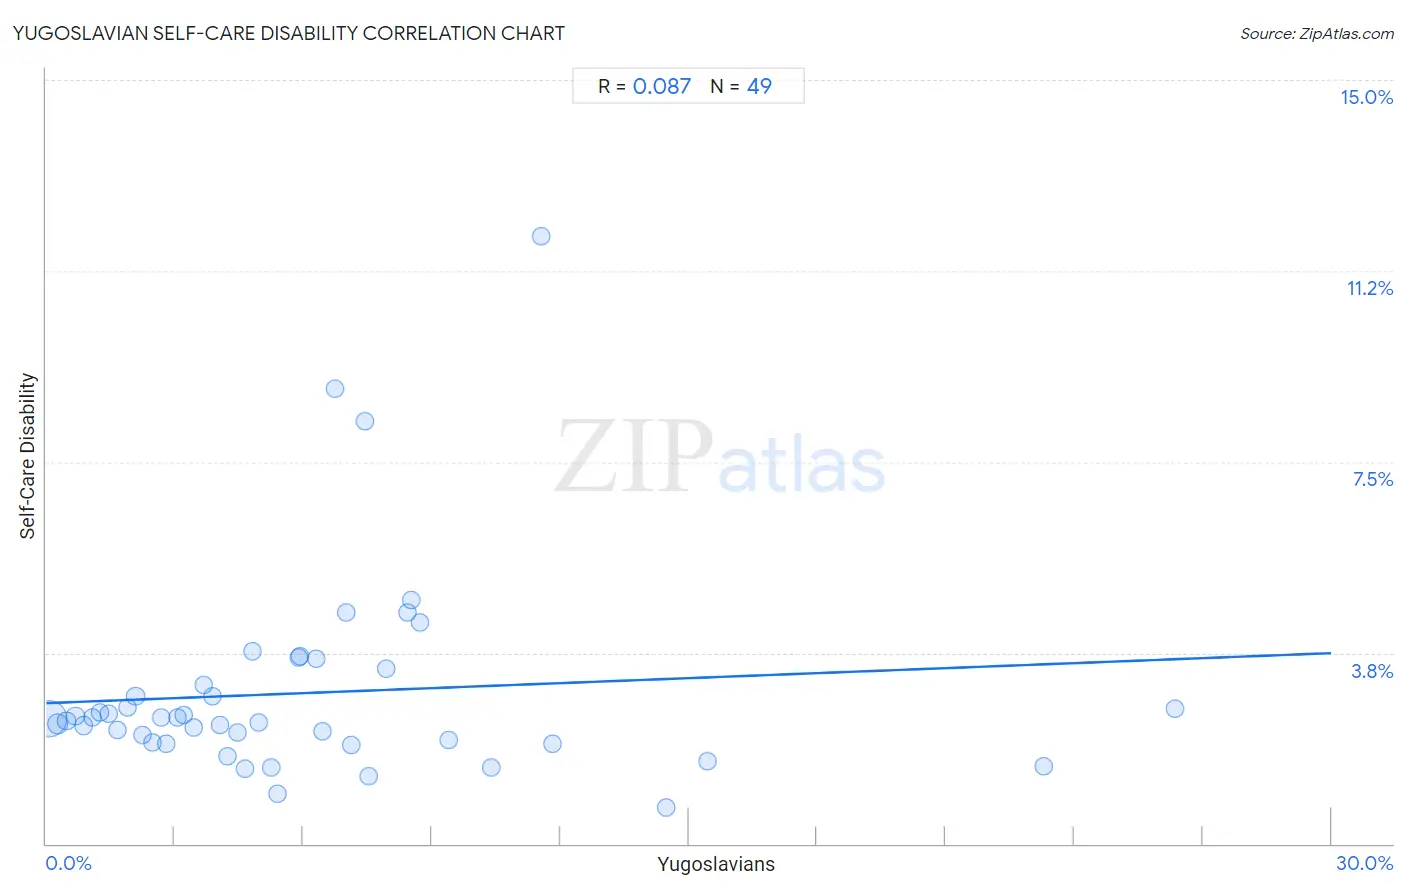
It is essential to understand that the correlation between the percentage of Yugoslavians and percentage of population with self-care disability does not imply a direct cause-and-effect relationship. It remains uncertain whether the presence of Yugoslavians influences an upward or downward trend in the level of percentage of population with self-care disability within an area, or if Yugoslavians simply ended up residing in those areas with higher or lower levels of percentage of population with self-care disability due to other factors.
Demographics Similar to Yugoslavians by Self-Care Disability
In terms of self-care disability, the demographic groups most similar to Yugoslavians are Salvadoran (2.5%, a difference of 0.020%), Maltese (2.5%, a difference of 0.070%), Slavic (2.5%, a difference of 0.090%), Immigrants from El Salvador (2.5%, a difference of 0.17%), and Ghanaian (2.5%, a difference of 0.21%).
| Demographics | Rating | Rank | Self-Care Disability |
| Immigrants from Kazakhstan | 46.7 /100 | #177 | Average 2.5% |
| English | 46.2 /100 | #178 | Average 2.5% |
| Hungarians | 45.5 /100 | #179 | Average 2.5% |
| Indonesians | 41.2 /100 | #180 | Average 2.5% |
| Ghanaians | 40.4 /100 | #181 | Average 2.5% |
| Maltese | 37.5 /100 | #182 | Fair 2.5% |
| Salvadorans | 36.4 /100 | #183 | Fair 2.5% |
| Yugoslavians | 36.1 /100 | #184 | Fair 2.5% |
| Slavs | 34.3 /100 | #185 | Fair 2.5% |
| Immigrants from El Salvador | 33.0 /100 | #186 | Fair 2.5% |
| Irish | 28.7 /100 | #187 | Fair 2.5% |
| Immigrants from Oceania | 28.3 /100 | #188 | Fair 2.5% |
| Immigrants from Eastern Europe | 28.0 /100 | #189 | Fair 2.5% |
| Sioux | 24.6 /100 | #190 | Fair 2.5% |
| Moroccans | 22.9 /100 | #191 | Fair 2.5% |
Yugoslavian Self-Care Disability Correlation Summary
| Measurement | Yugoslavian Data | Self-Care Disability Data |
| Minimum | 0.060% | 0.70% |
| Maximum | 26.3% | 11.9% |
| Range | 26.3% | 11.2% |
| Mean | 6.0% | 3.0% |
| Median | 4.8% | 2.5% |
| Interquartile 25% (IQ1) | 2.4% | 2.0% |
| Interquartile 75% (IQ3) | 7.7% | 3.3% |
| Interquartile Range (IQR) | 5.4% | 1.3% |
| Standard Deviation (Sample) | 5.3% | 2.0% |
| Standard Deviation (Population) | 5.3% | 2.0% |
Correlation Details
| Yugoslavian Percentile | Sample Size | Self-Care Disability |
[ 0.0% - 0.5% ] 0.060% | 238,991,425 | 2.5% |
[ 0.0% - 0.5% ] 0.28% | 27,814,291 | 2.4% |
[ 0.0% - 0.5% ] 0.48% | 8,620,248 | 2.4% |
[ 0.5% - 1.0% ] 0.68% | 3,559,931 | 2.5% |
[ 0.5% - 1.0% ] 0.87% | 2,182,328 | 2.3% |
[ 1.0% - 1.5% ] 1.08% | 1,090,430 | 2.5% |
[ 1.0% - 1.5% ] 1.26% | 748,488 | 2.6% |
[ 1.0% - 1.5% ] 1.47% | 390,984 | 2.5% |
[ 1.5% - 2.0% ] 1.66% | 388,995 | 2.2% |
[ 1.5% - 2.0% ] 1.89% | 372,401 | 2.7% |
[ 2.0% - 2.5% ] 2.09% | 269,008 | 2.9% |
[ 2.0% - 2.5% ] 2.24% | 194,750 | 2.1% |
[ 2.0% - 2.5% ] 2.47% | 115,538 | 2.0% |
[ 2.5% - 3.0% ] 2.68% | 164,049 | 2.5% |
[ 2.5% - 3.0% ] 2.79% | 44,297 | 2.0% |
[ 3.0% - 3.5% ] 3.06% | 28,175 | 2.5% |
[ 3.0% - 3.5% ] 3.22% | 50,604 | 2.5% |
[ 3.0% - 3.5% ] 3.45% | 84,293 | 2.3% |
[ 3.5% - 4.0% ] 3.67% | 5,070 | 3.1% |
[ 3.5% - 4.0% ] 3.87% | 7,176 | 2.9% |
[ 4.0% - 4.5% ] 4.05% | 11,563 | 2.3% |
[ 4.0% - 4.5% ] 4.22% | 32,592 | 1.7% |
[ 4.0% - 4.5% ] 4.48% | 10,273 | 2.2% |
[ 4.5% - 5.0% ] 4.64% | 4,851 | 1.5% |
[ 4.5% - 5.0% ] 4.82% | 10,264 | 3.8% |
[ 4.5% - 5.0% ] 4.97% | 71,284 | 2.4% |
[ 5.0% - 5.5% ] 5.26% | 22,286 | 1.5% |
[ 5.0% - 5.5% ] 5.40% | 537 | 0.97% |
[ 5.5% - 6.0% ] 5.89% | 950 | 3.7% |
[ 5.5% - 6.0% ] 5.92% | 64,728 | 3.7% |
[ 6.0% - 6.5% ] 6.31% | 317 | 3.6% |
[ 6.0% - 6.5% ] 6.46% | 19,922 | 2.2% |
[ 6.5% - 7.0% ] 6.75% | 1,022 | 8.9% |
[ 7.0% - 7.5% ] 7.01% | 16,211 | 4.5% |
[ 7.0% - 7.5% ] 7.12% | 4,947 | 1.9% |
[ 7.0% - 7.5% ] 7.43% | 4,873 | 8.3% |
[ 7.5% - 8.0% ] 7.53% | 332 | 1.3% |
[ 7.5% - 8.0% ] 7.93% | 29,089 | 3.4% |
[ 8.0% - 8.5% ] 8.43% | 36,359 | 4.6% |
[ 8.5% - 9.0% ] 8.52% | 622 | 4.8% |
[ 8.5% - 9.0% ] 8.74% | 40,152 | 4.4% |
[ 9.0% - 9.5% ] 9.39% | 2,280 | 2.0% |
[ 10.0% - 10.5% ] 10.40% | 846 | 1.5% |
[ 11.5% - 12.0% ] 11.55% | 502 | 11.9% |
[ 11.5% - 12.0% ] 11.80% | 881 | 2.0% |
[ 14.0% - 14.5% ] 14.48% | 3,812 | 0.70% |
[ 15.0% - 15.5% ] 15.44% | 136 | 1.6% |
[ 23.0% - 23.5% ] 23.29% | 73 | 1.5% |
[ 26.0% - 26.5% ] 26.35% | 1,875 | 2.7% |