Immigrants from Eastern Asia Self-Care Disability
COMPARE
Immigrants from Eastern Asia
Select to Compare
Self-Care Disability
Immigrants from Eastern Asia Self-Care Disability
2.3%
SELF-CARE DISABILITY
99.6/ 100
METRIC RATING
56th/ 347
METRIC RANK
Immigrants from Eastern Asia Self-Care Disability Correlation Chart
The statistical analysis conducted on geographies consisting of 498,784,533 people shows a weak positive correlation between the proportion of Immigrants from Eastern Asia and percentage of population with self-care disability in the United States with a correlation coefficient (R) of 0.263 and weighted average of 2.3%. On average, for every 1% (one percent) increase in Immigrants from Eastern Asia within a typical geography, there is an increase of 0.029% in percentage of population with self-care disability.
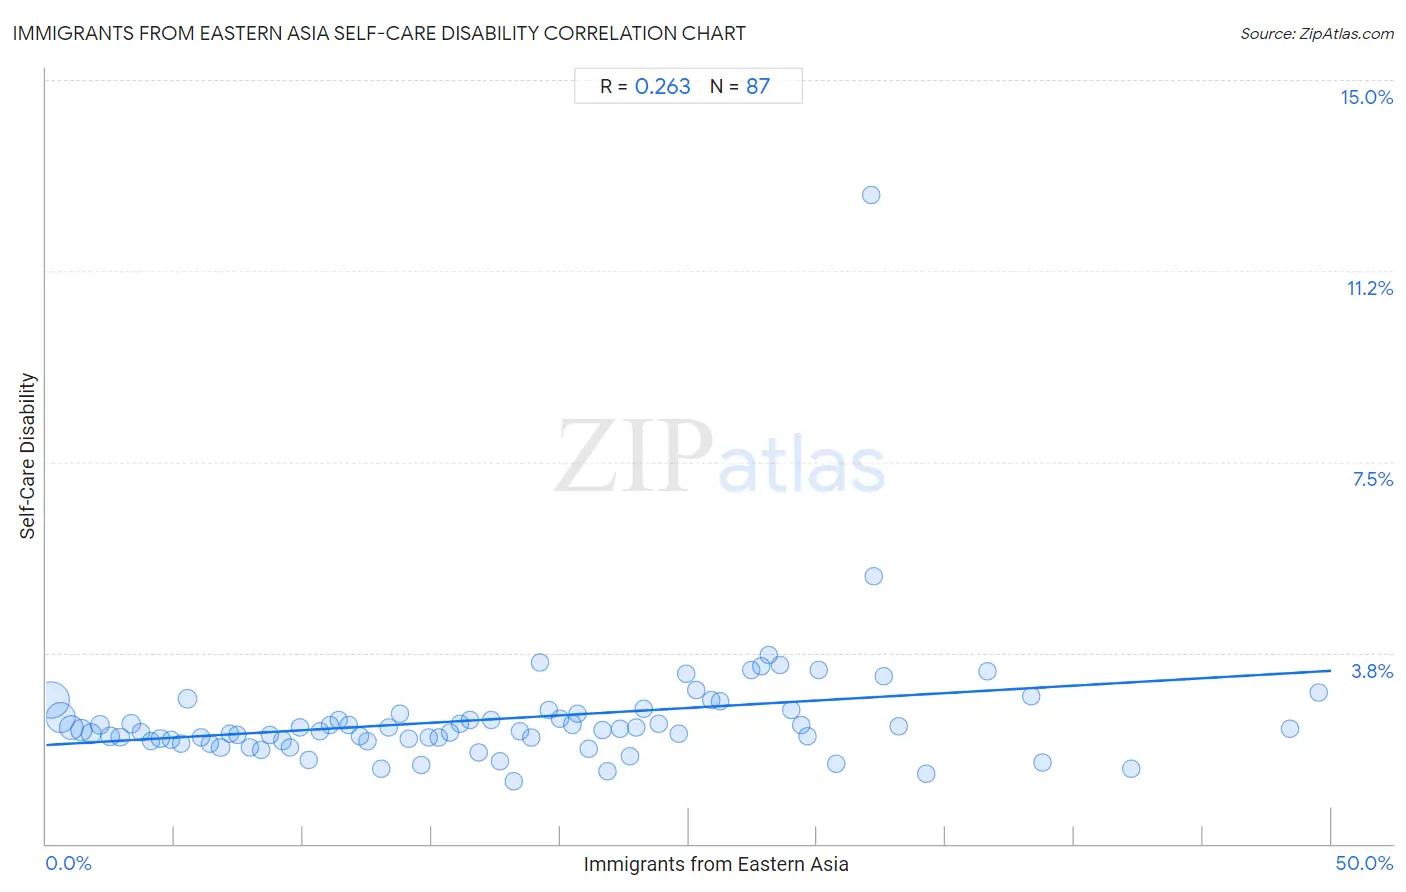
It is essential to understand that the correlation between the percentage of Immigrants from Eastern Asia and percentage of population with self-care disability does not imply a direct cause-and-effect relationship. It remains uncertain whether the presence of Immigrants from Eastern Asia influences an upward or downward trend in the level of percentage of population with self-care disability within an area, or if Immigrants from Eastern Asia simply ended up residing in those areas with higher or lower levels of percentage of population with self-care disability due to other factors.
Demographics Similar to Immigrants from Eastern Asia by Self-Care Disability
In terms of self-care disability, the demographic groups most similar to Immigrants from Eastern Asia are Immigrants from Belgium (2.3%, a difference of 0.010%), Immigrants from France (2.3%, a difference of 0.040%), Immigrants from Cameroon (2.3%, a difference of 0.080%), Argentinean (2.3%, a difference of 0.10%), and Australian (2.3%, a difference of 0.15%).
| Demographics | Rating | Rank | Self-Care Disability |
| Latvians | 99.7 /100 | #49 | Exceptional 2.3% |
| Immigrants from Brazil | 99.7 /100 | #50 | Exceptional 2.3% |
| Kenyans | 99.7 /100 | #51 | Exceptional 2.3% |
| Immigrants from Serbia | 99.6 /100 | #52 | Exceptional 2.3% |
| Australians | 99.6 /100 | #53 | Exceptional 2.3% |
| Argentineans | 99.6 /100 | #54 | Exceptional 2.3% |
| Immigrants from France | 99.6 /100 | #55 | Exceptional 2.3% |
| Immigrants from Eastern Asia | 99.6 /100 | #56 | Exceptional 2.3% |
| Immigrants from Belgium | 99.6 /100 | #57 | Exceptional 2.3% |
| Immigrants from Cameroon | 99.6 /100 | #58 | Exceptional 2.3% |
| New Zealanders | 99.5 /100 | #59 | Exceptional 2.3% |
| Immigrants from Japan | 99.5 /100 | #60 | Exceptional 2.3% |
| Palestinians | 99.4 /100 | #61 | Exceptional 2.3% |
| Egyptians | 99.4 /100 | #62 | Exceptional 2.3% |
| Mongolians | 99.3 /100 | #63 | Exceptional 2.3% |
Immigrants from Eastern Asia Self-Care Disability Correlation Summary
| Measurement | Immigrants from Eastern Asia Data | Self-Care Disability Data |
| Minimum | 0.19% | 1.2% |
| Maximum | 49.5% | 12.8% |
| Range | 49.3% | 11.5% |
| Mean | 17.8% | 2.5% |
| Median | 16.8% | 2.2% |
| Interquartile 25% (IQ1) | 8.3% | 2.0% |
| Interquartile 75% (IQ3) | 25.9% | 2.6% |
| Interquartile Range (IQR) | 17.5% | 0.53% |
| Standard Deviation (Sample) | 11.5% | 1.3% |
| Standard Deviation (Population) | 11.4% | 1.3% |
Correlation Details
| Immigrants from Eastern Asia Percentile | Sample Size | Self-Care Disability |
[ 0.0% - 0.5% ] 0.19% | 172,673,243 | 2.8% |
[ 0.5% - 1.0% ] 0.56% | 114,313,386 | 2.5% |
[ 0.5% - 1.0% ] 0.95% | 56,333,381 | 2.3% |
[ 1.0% - 1.5% ] 1.35% | 32,904,703 | 2.2% |
[ 1.5% - 2.0% ] 1.75% | 24,169,542 | 2.2% |
[ 2.0% - 2.5% ] 2.10% | 13,088,864 | 2.3% |
[ 2.0% - 2.5% ] 2.49% | 9,696,902 | 2.1% |
[ 2.5% - 3.0% ] 2.89% | 7,335,268 | 2.1% |
[ 3.0% - 3.5% ] 3.31% | 11,025,125 | 2.3% |
[ 3.5% - 4.0% ] 3.68% | 6,224,943 | 2.2% |
[ 4.0% - 4.5% ] 4.08% | 3,702,947 | 2.0% |
[ 4.0% - 4.5% ] 4.45% | 4,375,555 | 2.1% |
[ 4.5% - 5.0% ] 4.86% | 3,366,329 | 2.0% |
[ 5.0% - 5.5% ] 5.23% | 2,554,898 | 2.0% |
[ 5.5% - 6.0% ] 5.50% | 10,919,858 | 2.8% |
[ 6.0% - 6.5% ] 6.02% | 2,462,441 | 2.1% |
[ 6.0% - 6.5% ] 6.37% | 1,415,625 | 2.0% |
[ 6.5% - 7.0% ] 6.78% | 1,243,812 | 1.9% |
[ 7.0% - 7.5% ] 7.13% | 1,049,088 | 2.2% |
[ 7.0% - 7.5% ] 7.44% | 1,666,263 | 2.1% |
[ 7.5% - 8.0% ] 7.94% | 1,130,725 | 1.9% |
[ 8.0% - 8.5% ] 8.35% | 1,313,946 | 1.8% |
[ 8.5% - 9.0% ] 8.72% | 1,062,218 | 2.1% |
[ 9.0% - 9.5% ] 9.17% | 1,271,663 | 2.0% |
[ 9.5% - 10.0% ] 9.51% | 626,524 | 1.9% |
[ 9.5% - 10.0% ] 9.86% | 1,009,238 | 2.3% |
[ 10.0% - 10.5% ] 10.21% | 890,903 | 1.6% |
[ 10.5% - 11.0% ] 10.64% | 522,609 | 2.2% |
[ 11.0% - 11.5% ] 11.04% | 315,266 | 2.3% |
[ 11.0% - 11.5% ] 11.39% | 471,773 | 2.4% |
[ 11.5% - 12.0% ] 11.76% | 1,051,412 | 2.3% |
[ 12.0% - 12.5% ] 12.21% | 537,172 | 2.1% |
[ 12.5% - 13.0% ] 12.52% | 588,438 | 2.0% |
[ 13.0% - 13.5% ] 13.04% | 138,256 | 1.5% |
[ 13.0% - 13.5% ] 13.32% | 551,254 | 2.3% |
[ 13.5% - 14.0% ] 13.76% | 1,181,818 | 2.6% |
[ 14.0% - 14.5% ] 14.12% | 473,003 | 2.1% |
[ 14.5% - 15.0% ] 14.61% | 126,598 | 1.5% |
[ 14.5% - 15.0% ] 14.89% | 110,608 | 2.1% |
[ 15.0% - 15.5% ] 15.29% | 275,032 | 2.1% |
[ 15.5% - 16.0% ] 15.73% | 172,210 | 2.2% |
[ 16.0% - 16.5% ] 16.09% | 178,989 | 2.4% |
[ 16.0% - 16.5% ] 16.47% | 180,691 | 2.4% |
[ 16.5% - 17.0% ] 16.83% | 589,295 | 1.8% |
[ 17.0% - 17.5% ] 17.31% | 228,552 | 2.4% |
[ 17.5% - 18.0% ] 17.67% | 82,360 | 1.6% |
[ 18.0% - 18.5% ] 18.18% | 297 | 1.2% |
[ 18.0% - 18.5% ] 18.44% | 103,062 | 2.2% |
[ 18.5% - 19.0% ] 18.85% | 153,367 | 2.1% |
[ 19.0% - 19.5% ] 19.23% | 118,464 | 3.5% |
[ 19.5% - 20.0% ] 19.55% | 100,680 | 2.6% |
[ 19.5% - 20.0% ] 19.99% | 73,691 | 2.4% |
[ 20.0% - 20.5% ] 20.45% | 346,015 | 2.3% |
[ 20.5% - 21.0% ] 20.67% | 156,580 | 2.6% |
[ 21.0% - 21.5% ] 21.10% | 99,341 | 1.9% |
[ 21.5% - 22.0% ] 21.63% | 34,244 | 2.2% |
[ 21.5% - 22.0% ] 21.86% | 61,110 | 1.4% |
[ 22.0% - 22.5% ] 22.31% | 90,420 | 2.3% |
[ 22.5% - 23.0% ] 22.70% | 93,439 | 1.7% |
[ 22.5% - 23.0% ] 22.94% | 128,109 | 2.3% |
[ 23.0% - 23.5% ] 23.27% | 82,295 | 2.6% |
[ 23.5% - 24.0% ] 23.83% | 104,218 | 2.4% |
[ 24.5% - 25.0% ] 24.60% | 83,601 | 2.2% |
[ 24.5% - 25.0% ] 24.88% | 70,110 | 3.3% |
[ 25.0% - 25.5% ] 25.31% | 76,518 | 3.0% |
[ 25.5% - 26.0% ] 25.88% | 93,232 | 2.8% |
[ 26.0% - 26.5% ] 26.24% | 58,223 | 2.8% |
[ 27.0% - 27.5% ] 27.42% | 123,259 | 3.4% |
[ 27.5% - 28.0% ] 27.83% | 78,835 | 3.5% |
[ 28.0% - 28.5% ] 28.13% | 33,937 | 3.7% |
[ 28.5% - 29.0% ] 28.57% | 69,291 | 3.5% |
[ 29.0% - 29.5% ] 29.01% | 120,290 | 2.6% |
[ 29.0% - 29.5% ] 29.38% | 44,582 | 2.3% |
[ 29.5% - 30.0% ] 29.63% | 82,746 | 2.1% |
[ 30.0% - 30.5% ] 30.04% | 40,738 | 3.4% |
[ 30.5% - 31.0% ] 30.72% | 41,377 | 1.6% |
[ 32.0% - 32.5% ] 32.09% | 430 | 12.8% |
[ 32.0% - 32.5% ] 32.18% | 25,460 | 5.3% |
[ 32.5% - 33.0% ] 32.57% | 61,562 | 3.3% |
[ 33.0% - 33.5% ] 33.18% | 91,060 | 2.3% |
[ 34.0% - 34.5% ] 34.23% | 222 | 1.4% |
[ 36.5% - 37.0% ] 36.60% | 12,070 | 3.4% |
[ 38.0% - 38.5% ] 38.31% | 26,418 | 2.9% |
[ 38.5% - 39.0% ] 38.75% | 25,001 | 1.6% |
[ 42.0% - 42.5% ] 42.24% | 40,462 | 1.5% |
[ 48.0% - 48.5% ] 48.39% | 57,556 | 2.3% |
[ 49.0% - 49.5% ] 49.50% | 79,495 | 3.0% |