Immigrants from Latvia Self-Care Disability

COMPARE

Immigrants from Latvia
Race
Ancestry
AfghanAfricanAlaska NativeAlaskan AthabascanAlbanianAleutAlsatianAmericanApacheArabArapahoArgentineanArmenianAssyrian/Chaldean/SyriacAustralianAustrianBahamianBangladeshiBarbadianBasqueBelgianBelizeanBermudanBhutaneseBlackfeetBolivianBrazilianBritishBritish West IndianBulgarianBurmeseCajunCambodianCanadianCape VerdeanCarpatho RusynCelticCentral AmericanCentral American IndianCherokeeCheyenneChickasawChileanChineseChippewaChoctawColombianColvilleComancheCosta RicanCreeCreekCroatianCrowCubanCypriotCzechCzechoslovakianDanishDelawareDominicanDutchDutch West IndianEastern EuropeanEcuadorianEgyptianEnglishEstonianEthiopianEuropeanFijianFilipinoFinnishFrenchFrench American IndianFrench CanadianGermanGerman RussianGhanaianGreekGuamanian/ChamorroGuatemalanGuyaneseHaitianHmongHonduranHopiHoumaHungarianIcelanderIndian (Asian)IndonesianInupiatIranianIraqiIrishIroquoisIsraeliItalianJamaicanJapaneseJordanianKenyanKiowaKoreanLaotianLatvianLebaneseLiberianLithuanianLumbeeLuxembourgerMacedonianMalaysianMalteseMarshalleseMenomineeMexicanMexican American IndianMongolianMoroccanNative HawaiianNavajoNepaleseNew ZealanderNicaraguanNigerianNorthern EuropeanNorwegianOkinawanOsageOttawaPaiutePakistaniPalestinianPanamanianParaguayanPennsylvania GermanPeruvianPimaPolishPortuguesePotawatomiPuebloPuerto RicanPuget Sound SalishRomanianRussianSalvadoranSamoanScandinavianScotch-IrishScottishSeminoleSenegaleseSerbianShoshoneSierra LeoneanSiouxSlavicSlovakSloveneSomaliSouth AfricanSouth AmericanSouth American IndianSoviet UnionSpaniardSpanishSpanish AmericanSpanish American IndianSri LankanSubsaharan AfricanSudaneseSwedishSwissSyrianTaiwaneseThaiTlingit-HaidaTohono O'OdhamTonganTrinidadian and TobagonianTsimshianTurkishU.S. Virgin IslanderUgandanUkrainianUruguayanUteVenezuelanVietnameseWelshWest IndianYakamaYaquiYugoslavianYumanYup'ikZimbabwean
Immigration
NonimmigrantsImmigrantsAfghanistanAfricaAlbaniaArgentinaArmeniaAsiaAustraliaAustriaBahamasBangladeshBarbadosBelarusBelgiumBelizeBoliviaBosnia and HerzegovinaBrazilBulgariaBurma/MyanmarCabo VerdeCambodiaCameroonCanadaCaribbeanCentral AmericaChileChinaColombiaCongoCosta RicaCroatiaCubaCzechoslovakiaDenmarkDominicaDominican RepublicEastern AfricaEastern AsiaEastern EuropeEcuadorEgyptEl SalvadorEnglandEritreaEthiopiaEuropeFijiFranceGermanyGhanaGreeceGrenadaGuatemalaGuyanaHaitiHondurasHong KongHungaryIndiaIndonesiaIranIraqIrelandIsraelItalyJamaicaJapanJordanKazakhstanKenyaKoreaKuwaitLaosLatin AmericaLatviaLebanonLiberiaLithuaniaMalaysiaMexicoMicronesiaMiddle AfricaMoldovaMoroccoNepalNetherlandsNicaraguaNigeriaNorth AmericaNorth MacedoniaNorthern AfricaNorthern EuropeNorwayOceaniaPakistanPanamaPeruPhilippinesPolandPortugalRomaniaRussiaSaudi ArabiaScotlandSenegalSerbiaSierra LeoneSingaporeSomaliaSouth AfricaSouth AmericaSouth Central AsiaSouth Eastern AsiaSouthern EuropeSpainSri LankaSt. Vincent and the GrenadinesSudanSwedenSwitzerlandSyriaTaiwanThailandTrinidad and TobagoTurkeyUgandaUkraineUruguayUzbekistanVenezuelaVietnamWest IndiesWestern AfricaWestern AsiaWestern EuropeYemenZaireZimbabweAzores
Select to Compare
Race
Ancestry
AfghanAfricanAlaska NativeAlaskan AthabascanAlbanianAleutAlsatianAmericanApacheArabArapahoArgentineanArmenianAssyrian/Chaldean/SyriacAustralianAustrianBahamianBangladeshiBarbadianBasqueBelgianBelizeanBermudanBhutaneseBlackfeetBolivianBrazilianBritishBritish West IndianBulgarianBurmeseCajunCambodianCanadianCape VerdeanCarpatho RusynCelticCentral AmericanCentral American IndianCherokeeCheyenneChickasawChileanChineseChippewaChoctawColombianColvilleComancheCosta RicanCreeCreekCroatianCrowCubanCypriotCzechCzechoslovakianDanishDelawareDominicanDutchDutch West IndianEastern EuropeanEcuadorianEgyptianEnglishEstonianEthiopianEuropeanFijianFilipinoFinnishFrenchFrench American IndianFrench CanadianGermanGerman RussianGhanaianGreekGuamanian/ChamorroGuatemalanGuyaneseHaitianHmongHonduranHopiHoumaHungarianIcelanderIndian (Asian)IndonesianInupiatIranianIraqiIrishIroquoisIsraeliItalianJamaicanJapaneseJordanianKenyanKiowaKoreanLaotianLatvianLebaneseLiberianLithuanianLumbeeLuxembourgerMacedonianMalaysianMalteseMarshalleseMenomineeMexicanMexican American IndianMongolianMoroccanNative HawaiianNavajoNepaleseNew ZealanderNicaraguanNigerianNorthern EuropeanNorwegianOkinawanOsageOttawaPaiutePakistaniPalestinianPanamanianParaguayanPennsylvania GermanPeruvianPimaPolishPortuguesePotawatomiPuebloPuerto RicanPuget Sound SalishRomanianRussianSalvadoranSamoanScandinavianScotch-IrishScottishSeminoleSenegaleseSerbianShoshoneSierra LeoneanSiouxSlavicSlovakSloveneSomaliSouth AfricanSouth AmericanSouth American IndianSoviet UnionSpaniardSpanishSpanish AmericanSpanish American IndianSri LankanSubsaharan AfricanSudaneseSwedishSwissSyrianTaiwaneseThaiTlingit-HaidaTohono O'OdhamTonganTrinidadian and TobagonianTsimshianTurkishU.S. Virgin IslanderUgandanUkrainianUruguayanUteVenezuelanVietnameseWelshWest IndianYakamaYaquiYugoslavianYumanYup'ikZimbabwean
Immigration
NonimmigrantsImmigrantsAfghanistanAfricaAlbaniaArgentinaArmeniaAsiaAustraliaAustriaBahamasBangladeshBarbadosBelarusBelgiumBelizeBoliviaBosnia and HerzegovinaBrazilBulgariaBurma/MyanmarCabo VerdeCambodiaCameroonCanadaCaribbeanCentral AmericaChileChinaColombiaCongoCosta RicaCroatiaCubaCzechoslovakiaDenmarkDominicaDominican RepublicEastern AfricaEastern AsiaEastern EuropeEcuadorEgyptEl SalvadorEnglandEritreaEthiopiaEuropeFijiFranceGermanyGhanaGreeceGrenadaGuatemalaGuyanaHaitiHondurasHong KongHungaryIndiaIndonesiaIranIraqIrelandIsraelItalyJamaicaJapanJordanKazakhstanKenyaKoreaKuwaitLaosLatin AmericaLebanonLiberiaLithuaniaMalaysiaMexicoMicronesiaMiddle AfricaMoldovaMoroccoNepalNetherlandsNicaraguaNigeriaNorth AmericaNorth MacedoniaNorthern AfricaNorthern EuropeNorwayOceaniaPakistanPanamaPeruPhilippinesPolandPortugalRomaniaRussiaSaudi ArabiaScotlandSenegalSerbiaSierra LeoneSingaporeSomaliaSouth AfricaSouth AmericaSouth Central AsiaSouth Eastern AsiaSouthern EuropeSpainSri LankaSt. Vincent and the GrenadinesSudanSwedenSwitzerlandSyriaTaiwanThailandTrinidad and TobagoTurkeyUgandaUkraineUruguayUzbekistanVenezuelaVietnamWest IndiesWestern AfricaWestern AsiaWestern EuropeYemenZaireZimbabweAzores
Self-Care Disability
Income
Poverty
Unemployment
Labor Participation
Family Structure
Vehicle Availability
Education Level
Disability

Immigrants from Latvia Self-Care Disability
Exceptional

2.4%
SELF-CARE DISABILITY
97.0/ 100
METRIC RATING
93rd/ 347
METRIC RANK

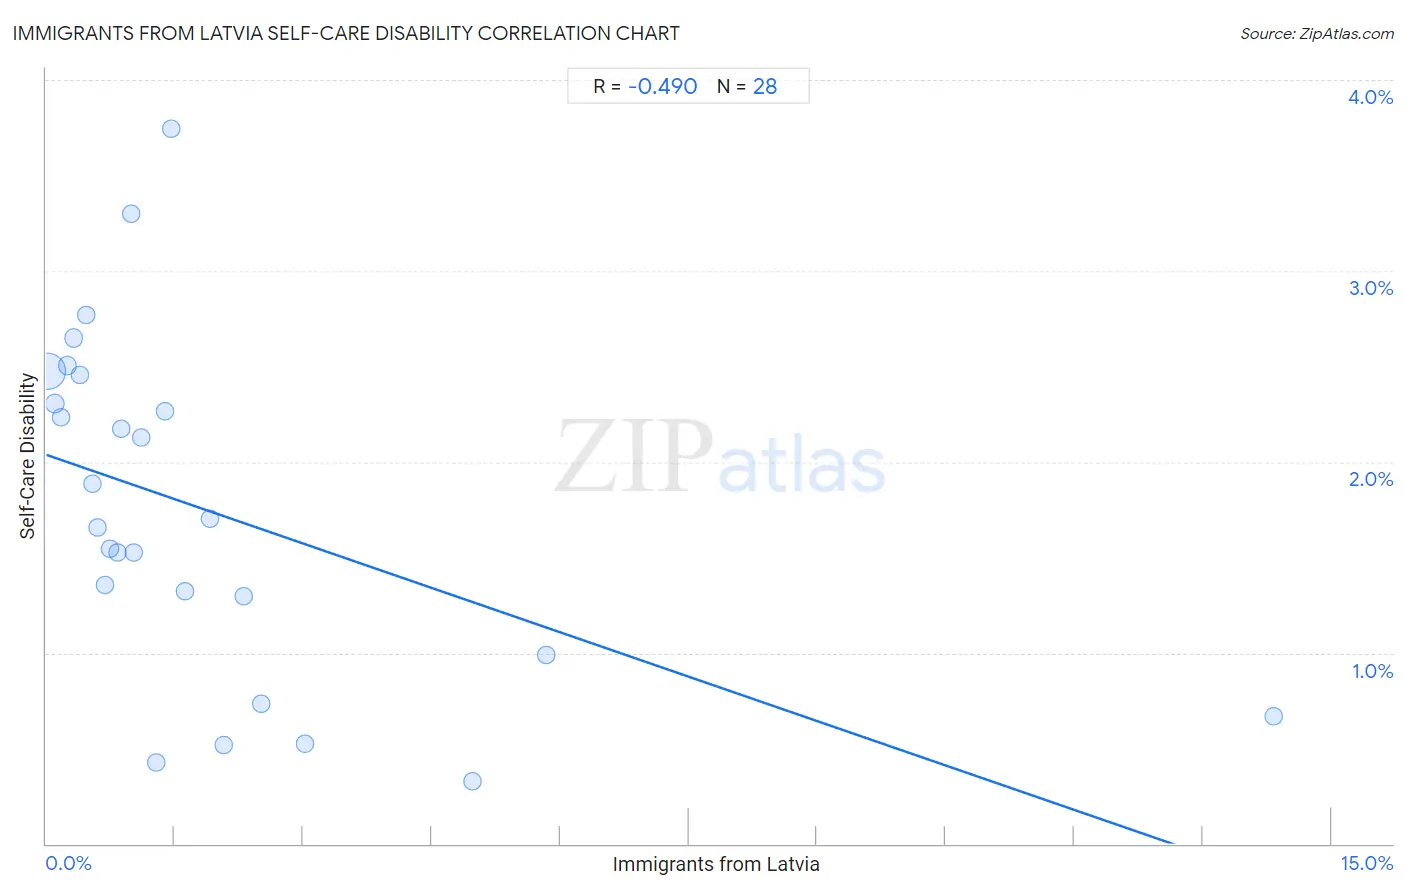
Immigrants from Latvia Self-Care Disability Correlation Chart

The statistical analysis conducted on geographies consisting of 113,697,152 people shows a moderate negative correlation between the proportion of Immigrants from Latvia and percentage of population with self-care disability in the United States with a correlation coefficient (R) of -0.490 and weighted average of 2.4%. On average, for every 1% (one percent) increase in Immigrants from Latvia within a typical geography, there is a decrease of 0.15% in percentage of population with self-care disability.
Immigrants from Latvia Self-Care Disability
It is essential to understand that the correlation between the percentage of Immigrants from Latvia and percentage of population with self-care disability does not imply a direct cause-and-effect relationship. It remains uncertain whether the presence of Immigrants from Latvia influences an upward or downward trend in the level of percentage of population with self-care disability within an area, or if Immigrants from Latvia simply ended up residing in those areas with higher or lower levels of percentage of population with self-care disability due to other factors.

Demographics Similar to Immigrants from Latvia by Self-Care Disability

In terms of self-care disability, the demographic groups most similar to Immigrants from Latvia are Macedonian (2.4%, a difference of 0.040%), Immigrants from Asia (2.4%, a difference of 0.050%), Immigrants from Chile (2.4%, a difference of 0.11%), Swiss (2.4%, a difference of 0.16%), and Icelander (2.4%, a difference of 0.19%).
DemographicsRating | RankSelf-Care Disability
Immigrants from Northern Africa
98.2
/100
|
#86
Exceptional
2.3%
Sierra Leoneans
98.0
/100
|
#87
Exceptional
2.4%
Lithuanians
98.0
/100
|
#88
Exceptional
2.4%
Immigrants from Congo
98.0
/100
|
#89
Exceptional
2.4%
Immigrants from Czechoslovakia
97.7
/100
|
#90
Exceptional
2.4%
Immigrants from Jordan
97.7
/100
|
#91
Exceptional
2.4%
Icelanders
97.4
/100
|
#92
Exceptional
2.4%
Immigrants from Latvia
97.0
/100
|
#93
Exceptional
2.4%
Macedonians
96.9
/100
|
#94
Exceptional
2.4%
Immigrants from Asia
96.9
/100
|
#95
Exceptional
2.4%
Immigrants from Chile
96.7
/100
|
#96
Exceptional
2.4%
Swiss
96.6
/100
|
#97
Exceptional
2.4%
Immigrants from Poland
96.4
/100
|
#98
Exceptional
2.4%
Immigrants from Israel
96.1
/100
|
#99
Exceptional
2.4%
Europeans
95.8
/100
|
#100
Exceptional
2.4%

Immigrants from Latvia Self-Care Disability Correlation Summary

MeasurementImmigrants from Latvia DataSelf-Care Disability Data
Minimum0.020%0.33%
Maximum14.3%3.7%
Range14.3%3.4%
Mean1.9%1.8%
Median1.0%1.7%
Interquartile 25% (IQ1)0.50%1.1%
Interquartile 75% (IQ3)2.0%2.4%
Interquartile Range (IQR)1.5%1.2%
Standard Deviation (Sample)2.8%0.89%
Standard Deviation (Population)2.8%0.87%

Correlation Details

Immigrants from Latvia PercentileSample SizeSelf-Care Disability
[
0.0%
-
0.5%
]
0.020%
100,030,2572.5%
[
0.0%
-
0.5%
]
0.100%
8,834,3392.3%
[
0.0%
-
0.5%
]
0.17%
2,270,2432.2%
[
0.0%
-
0.5%
]
0.25%
1,181,9402.5%
[
0.0%
-
0.5%
]
0.32%
576,0462.6%
[
0.0%
-
0.5%
]
0.40%
336,1642.5%
[
0.0%
-
0.5%
]
0.46%
147,3362.8%
[
0.5%
-
1.0%
]
0.54%
68,1921.9%
[
0.5%
-
1.0%
]
0.60%
26,7401.7%
[
0.5%
-
1.0%
]
0.69%
66,5001.4%
[
0.5%
-
1.0%
]
0.74%
14,7731.5%
[
0.5%
-
1.0%
]
0.83%
11,0541.5%
[
0.5%
-
1.0%
]
0.87%
72,9292.2%
[
0.5%
-
1.0%
]
0.99%
4,5283.3%
[
1.0%
-
1.5%
]
1.02%
5,7761.5%
[
1.0%
-
1.5%
]
1.11%
5,4042.1%
[
1.0%
-
1.5%
]
1.29%
1,2400.43%
[
1.0%
-
1.5%
]
1.39%
4,2482.3%
[
1.0%
-
1.5%
]
1.46%
12,9953.7%
[
1.5%
-
2.0%
]
1.62%
2,0361.3%
[
1.5%
-
2.0%
]
1.91%
7,8971.7%
[
2.0%
-
2.5%
]
2.08%
7710.52%
[
2.0%
-
2.5%
]
2.30%
5641.3%
[
2.5%
-
3.0%
]
2.51%
2790.74%
[
3.0%
-
3.5%
]
3.03%
8,4250.52%
[
4.5%
-
5.0%
]
4.97%
4,2630.33%
[
5.5%
-
6.0%
]
5.83%
2230.99%
[
14.0%
-
14.5%
]
14.32%
1,9900.67%