Immigrants from Colombia Self-Care Disability
COMPARE
Immigrants from Colombia
Select to Compare
Self-Care Disability
Immigrants from Colombia Self-Care Disability
2.4%
SELF-CARE DISABILITY
88.5/ 100
METRIC RATING
133rd/ 347
METRIC RANK
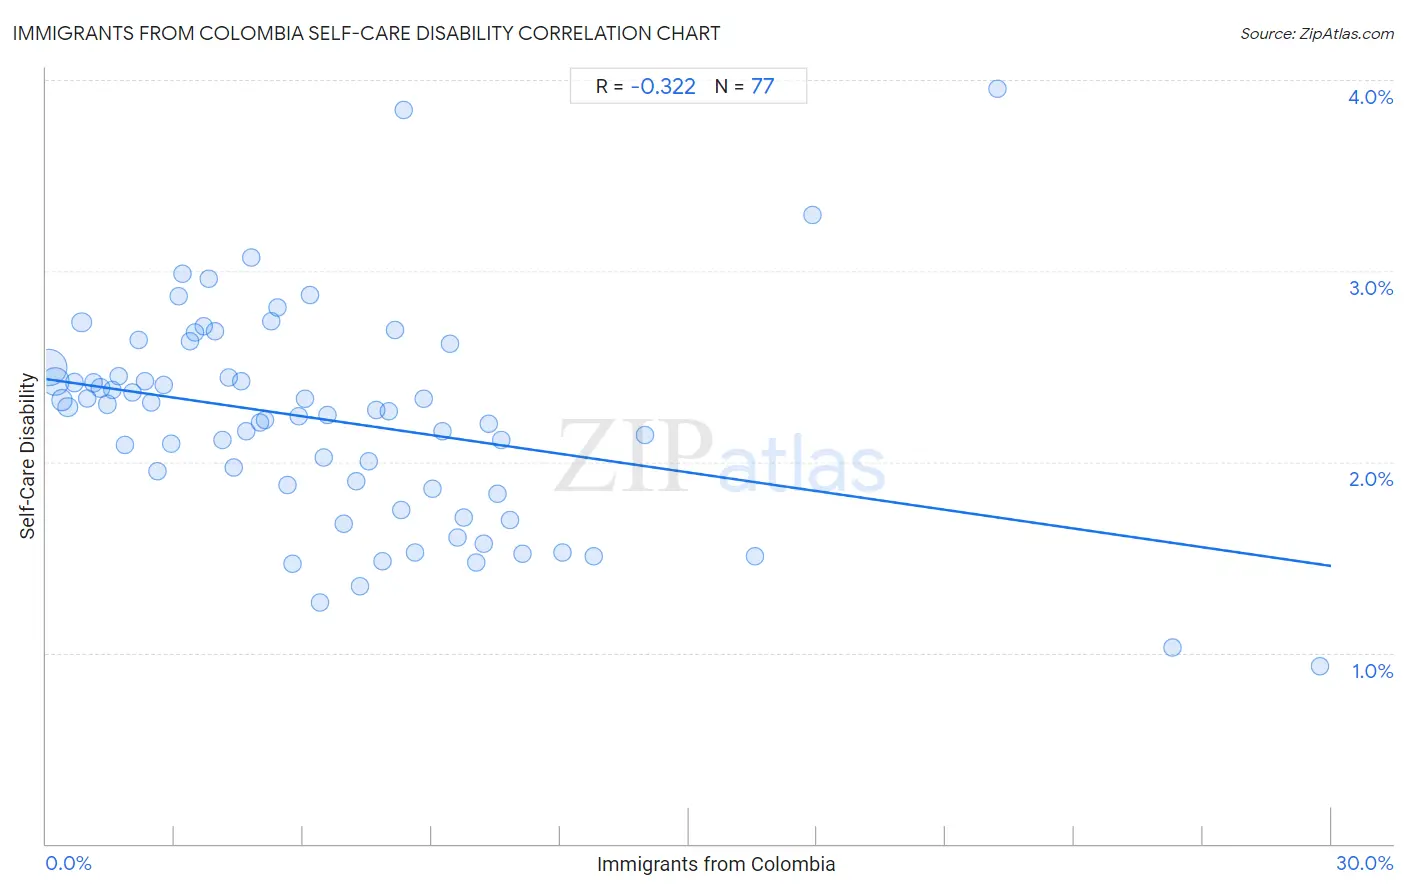
Immigrants from Colombia Self-Care Disability Correlation Chart
The statistical analysis conducted on geographies consisting of 378,342,946 people shows a mild negative correlation between the proportion of Immigrants from Colombia and percentage of population with self-care disability in the United States with a correlation coefficient (R) of -0.322 and weighted average of 2.4%. On average, for every 1% (one percent) increase in Immigrants from Colombia within a typical geography, there is a decrease of 0.033% in percentage of population with self-care disability.
It is essential to understand that the correlation between the percentage of Immigrants from Colombia and percentage of population with self-care disability does not imply a direct cause-and-effect relationship. It remains uncertain whether the presence of Immigrants from Colombia influences an upward or downward trend in the level of percentage of population with self-care disability within an area, or if Immigrants from Colombia simply ended up residing in those areas with higher or lower levels of percentage of population with self-care disability due to other factors.
Demographics Similar to Immigrants from Colombia by Self-Care Disability
In terms of self-care disability, the demographic groups most similar to Immigrants from Colombia are Immigrants from South America (2.4%, a difference of 0.030%), Polish (2.4%, a difference of 0.040%), Russian (2.4%, a difference of 0.040%), Immigrants from Austria (2.4%, a difference of 0.060%), and Immigrants from Romania (2.4%, a difference of 0.090%).
| Demographics | Rating | Rank | Self-Care Disability |
| Hmong | 89.9 /100 | #126 | Excellent 2.4% |
| Colombians | 89.7 /100 | #127 | Excellent 2.4% |
| Immigrants from Hungary | 89.6 /100 | #128 | Excellent 2.4% |
| Immigrants from Romania | 89.3 /100 | #129 | Excellent 2.4% |
| Immigrants from Austria | 89.0 /100 | #130 | Excellent 2.4% |
| Poles | 88.9 /100 | #131 | Excellent 2.4% |
| Immigrants from South America | 88.8 /100 | #132 | Excellent 2.4% |
| Immigrants from Colombia | 88.5 /100 | #133 | Excellent 2.4% |
| Russians | 88.2 /100 | #134 | Excellent 2.4% |
| Laotians | 87.8 /100 | #135 | Excellent 2.4% |
| South American Indians | 87.2 /100 | #136 | Excellent 2.4% |
| Austrians | 87.0 /100 | #137 | Excellent 2.4% |
| Immigrants from Croatia | 86.6 /100 | #138 | Excellent 2.4% |
| Sri Lankans | 86.6 /100 | #139 | Excellent 2.4% |
| Immigrants from Uruguay | 85.4 /100 | #140 | Excellent 2.4% |
Immigrants from Colombia Self-Care Disability Correlation Summary
| Measurement | Immigrants from Colombia Data | Self-Care Disability Data |
| Minimum | 0.069% | 0.93% |
| Maximum | 29.7% | 4.0% |
| Range | 29.7% | 3.0% |
| Mean | 6.7% | 2.2% |
| Median | 5.7% | 2.3% |
| Interquartile 25% (IQ1) | 2.8% | 1.8% |
| Interquartile 75% (IQ3) | 9.1% | 2.5% |
| Interquartile Range (IQR) | 6.3% | 0.62% |
| Standard Deviation (Sample) | 5.5% | 0.56% |
| Standard Deviation (Population) | 5.5% | 0.56% |
Correlation Details
| Immigrants from Colombia Percentile | Sample Size | Self-Care Disability |
[ 0.0% - 0.5% ] 0.069% | 175,543,594 | 2.5% |
[ 0.0% - 0.5% ] 0.21% | 89,443,110 | 2.4% |
[ 0.0% - 0.5% ] 0.37% | 33,635,992 | 2.3% |
[ 0.5% - 1.0% ] 0.51% | 18,776,150 | 2.3% |
[ 0.5% - 1.0% ] 0.66% | 10,456,671 | 2.4% |
[ 0.5% - 1.0% ] 0.83% | 15,665,843 | 2.7% |
[ 0.5% - 1.0% ] 0.96% | 4,850,959 | 2.3% |
[ 1.0% - 1.5% ] 1.11% | 4,344,619 | 2.4% |
[ 1.0% - 1.5% ] 1.26% | 2,965,334 | 2.4% |
[ 1.0% - 1.5% ] 1.42% | 2,387,001 | 2.3% |
[ 1.5% - 2.0% ] 1.55% | 2,111,669 | 2.4% |
[ 1.5% - 2.0% ] 1.70% | 1,622,262 | 2.4% |
[ 1.5% - 2.0% ] 1.84% | 1,376,043 | 2.1% |
[ 2.0% - 2.5% ] 2.01% | 993,654 | 2.4% |
[ 2.0% - 2.5% ] 2.16% | 1,415,267 | 2.6% |
[ 2.0% - 2.5% ] 2.30% | 592,688 | 2.4% |
[ 2.0% - 2.5% ] 2.44% | 701,445 | 2.3% |
[ 2.5% - 3.0% ] 2.60% | 669,818 | 1.9% |
[ 2.5% - 3.0% ] 2.75% | 700,553 | 2.4% |
[ 2.5% - 3.0% ] 2.91% | 768,372 | 2.1% |
[ 3.0% - 3.5% ] 3.08% | 1,043,598 | 2.9% |
[ 3.0% - 3.5% ] 3.17% | 528,669 | 3.0% |
[ 3.0% - 3.5% ] 3.34% | 449,447 | 2.6% |
[ 3.0% - 3.5% ] 3.47% | 804,095 | 2.7% |
[ 3.5% - 4.0% ] 3.67% | 486,213 | 2.7% |
[ 3.5% - 4.0% ] 3.80% | 521,806 | 3.0% |
[ 3.5% - 4.0% ] 3.95% | 621,554 | 2.7% |
[ 4.0% - 4.5% ] 4.12% | 390,801 | 2.1% |
[ 4.0% - 4.5% ] 4.25% | 324,806 | 2.4% |
[ 4.0% - 4.5% ] 4.39% | 116,706 | 2.0% |
[ 4.5% - 5.0% ] 4.56% | 180,514 | 2.4% |
[ 4.5% - 5.0% ] 4.66% | 274,663 | 2.2% |
[ 4.5% - 5.0% ] 4.78% | 92,461 | 3.1% |
[ 4.5% - 5.0% ] 4.98% | 167,153 | 2.2% |
[ 5.0% - 5.5% ] 5.11% | 430,423 | 2.2% |
[ 5.0% - 5.5% ] 5.25% | 337,142 | 2.7% |
[ 5.0% - 5.5% ] 5.40% | 95,759 | 2.8% |
[ 5.5% - 6.0% ] 5.63% | 70,197 | 1.9% |
[ 5.5% - 6.0% ] 5.74% | 40,707 | 1.5% |
[ 5.5% - 6.0% ] 5.89% | 258,669 | 2.2% |
[ 6.0% - 6.5% ] 6.03% | 131,861 | 2.3% |
[ 6.0% - 6.5% ] 6.16% | 110,032 | 2.9% |
[ 6.0% - 6.5% ] 6.38% | 44,893 | 1.3% |
[ 6.0% - 6.5% ] 6.48% | 126,255 | 2.0% |
[ 6.5% - 7.0% ] 6.57% | 98,113 | 2.2% |
[ 6.5% - 7.0% ] 6.94% | 66,333 | 1.7% |
[ 7.0% - 7.5% ] 7.25% | 35,967 | 1.9% |
[ 7.0% - 7.5% ] 7.32% | 33,204 | 1.3% |
[ 7.5% - 8.0% ] 7.52% | 85,062 | 2.0% |
[ 7.5% - 8.0% ] 7.71% | 135,665 | 2.3% |
[ 7.5% - 8.0% ] 7.84% | 34,809 | 1.5% |
[ 7.5% - 8.0% ] 7.98% | 67,213 | 2.3% |
[ 8.0% - 8.5% ] 8.13% | 68,157 | 2.7% |
[ 8.0% - 8.5% ] 8.28% | 28,693 | 1.7% |
[ 8.0% - 8.5% ] 8.34% | 121,169 | 3.8% |
[ 8.5% - 9.0% ] 8.61% | 50,017 | 1.5% |
[ 8.5% - 9.0% ] 8.82% | 150,087 | 2.3% |
[ 9.0% - 9.5% ] 9.02% | 110,087 | 1.9% |
[ 9.0% - 9.5% ] 9.26% | 57,557 | 2.2% |
[ 9.0% - 9.5% ] 9.42% | 45,481 | 2.6% |
[ 9.5% - 10.0% ] 9.60% | 39,141 | 1.6% |
[ 9.5% - 10.0% ] 9.74% | 115,726 | 1.7% |
[ 10.0% - 10.5% ] 10.04% | 109,774 | 1.5% |
[ 10.0% - 10.5% ] 10.21% | 58,094 | 1.6% |
[ 10.0% - 10.5% ] 10.34% | 6,202 | 2.2% |
[ 10.5% - 11.0% ] 10.54% | 16,651 | 1.8% |
[ 10.5% - 11.0% ] 10.63% | 15,622 | 2.1% |
[ 10.5% - 11.0% ] 10.84% | 45,357 | 1.7% |
[ 11.0% - 11.5% ] 11.11% | 18,426 | 1.5% |
[ 12.0% - 12.5% ] 12.05% | 31,514 | 1.5% |
[ 12.5% - 13.0% ] 12.78% | 7,217 | 1.5% |
[ 13.5% - 14.0% ] 13.98% | 11,069 | 2.1% |
[ 16.5% - 17.0% ] 16.54% | 133 | 1.5% |
[ 17.5% - 18.0% ] 17.88% | 6,186 | 3.3% |
[ 22.0% - 22.5% ] 22.22% | 180 | 4.0% |
[ 26.0% - 26.5% ] 26.29% | 1,761 | 1.0% |
[ 29.5% - 30.0% ] 29.74% | 2,811 | 0.93% |