Immigrants from Croatia Self-Care Disability
COMPARE
Immigrants from Croatia
Select to Compare
Self-Care Disability
Immigrants from Croatia Self-Care Disability
2.4%
SELF-CARE DISABILITY
86.6/ 100
METRIC RATING
138th/ 347
METRIC RANK
Immigrants from Croatia Self-Care Disability Correlation Chart
The statistical analysis conducted on geographies consisting of 132,547,892 people shows no correlation between the proportion of Immigrants from Croatia and percentage of population with self-care disability in the United States with a correlation coefficient (R) of 0.003 and weighted average of 2.4%. On average, for every 1% (one percent) increase in Immigrants from Croatia within a typical geography, there is an increase of 0.0016% in percentage of population with self-care disability.
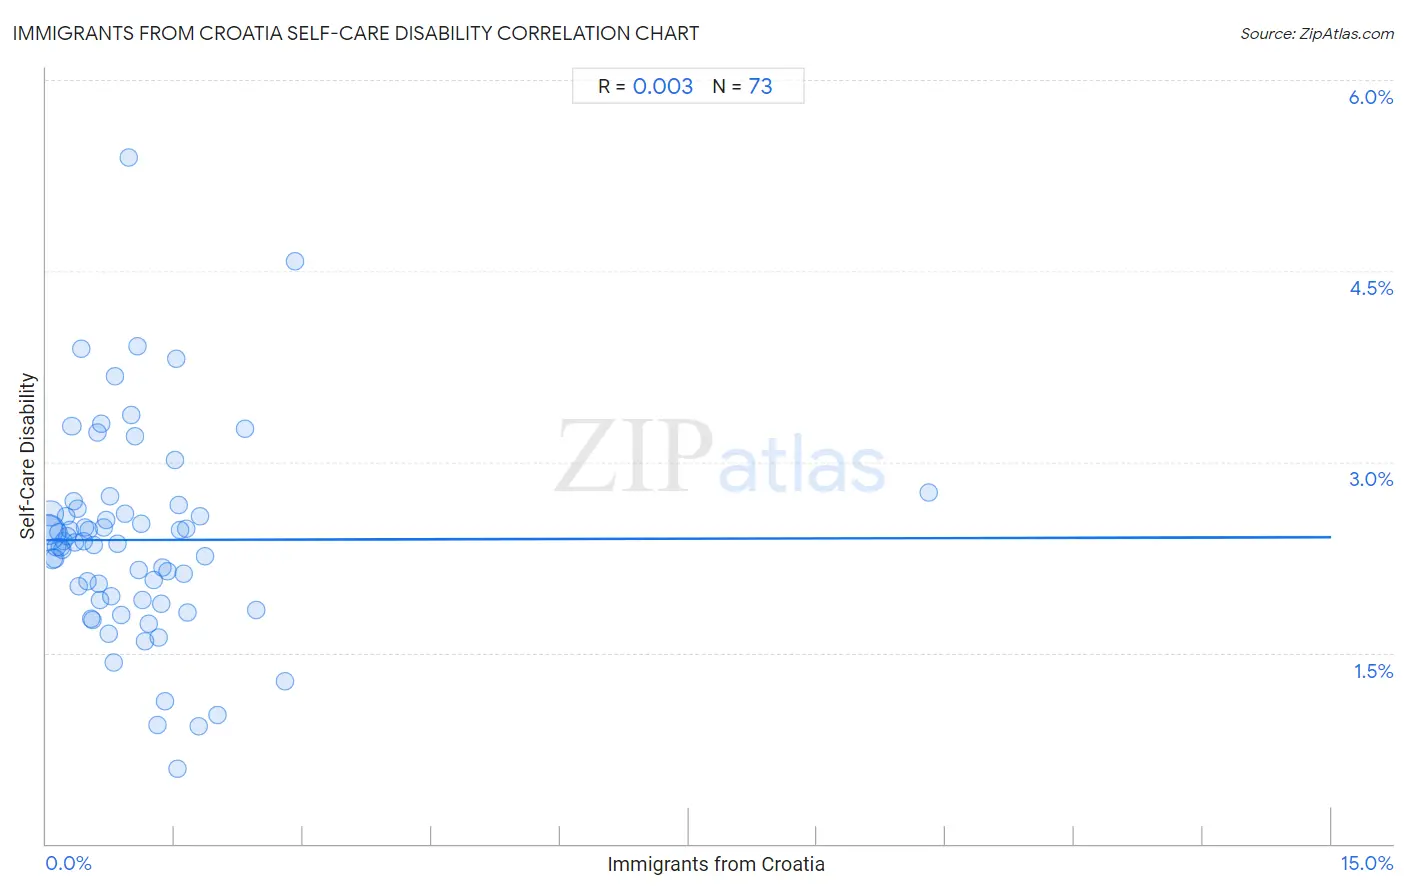
It is essential to understand that the correlation between the percentage of Immigrants from Croatia and percentage of population with self-care disability does not imply a direct cause-and-effect relationship. It remains uncertain whether the presence of Immigrants from Croatia influences an upward or downward trend in the level of percentage of population with self-care disability within an area, or if Immigrants from Croatia simply ended up residing in those areas with higher or lower levels of percentage of population with self-care disability due to other factors.
Demographics Similar to Immigrants from Croatia by Self-Care Disability
In terms of self-care disability, the demographic groups most similar to Immigrants from Croatia are Sri Lankan (2.4%, a difference of 0.0%), Austrian (2.4%, a difference of 0.050%), South American Indian (2.4%, a difference of 0.070%), Immigrants from Uruguay (2.4%, a difference of 0.12%), and Laotian (2.4%, a difference of 0.13%).
| Demographics | Rating | Rank | Self-Care Disability |
| Poles | 88.9 /100 | #131 | Excellent 2.4% |
| Immigrants from South America | 88.8 /100 | #132 | Excellent 2.4% |
| Immigrants from Colombia | 88.5 /100 | #133 | Excellent 2.4% |
| Russians | 88.2 /100 | #134 | Excellent 2.4% |
| Laotians | 87.8 /100 | #135 | Excellent 2.4% |
| South American Indians | 87.2 /100 | #136 | Excellent 2.4% |
| Austrians | 87.0 /100 | #137 | Excellent 2.4% |
| Immigrants from Croatia | 86.6 /100 | #138 | Excellent 2.4% |
| Sri Lankans | 86.6 /100 | #139 | Excellent 2.4% |
| Immigrants from Uruguay | 85.4 /100 | #140 | Excellent 2.4% |
| Alaska Natives | 84.5 /100 | #141 | Excellent 2.4% |
| Immigrants from Peru | 83.2 /100 | #142 | Excellent 2.4% |
| Afghans | 82.3 /100 | #143 | Excellent 2.4% |
| Costa Ricans | 80.8 /100 | #144 | Excellent 2.4% |
| Germans | 80.1 /100 | #145 | Excellent 2.4% |
Immigrants from Croatia Self-Care Disability Correlation Summary
| Measurement | Immigrants from Croatia Data | Self-Care Disability Data |
| Minimum | 0.010% | 0.59% |
| Maximum | 10.3% | 5.4% |
| Range | 10.3% | 4.8% |
| Mean | 1.1% | 2.4% |
| Median | 0.80% | 2.4% |
| Interquartile 25% (IQ1) | 0.40% | 1.9% |
| Interquartile 75% (IQ3) | 1.4% | 2.6% |
| Interquartile Range (IQR) | 1.00% | 0.70% |
| Standard Deviation (Sample) | 1.3% | 0.81% |
| Standard Deviation (Population) | 1.3% | 0.80% |
Correlation Details
| Immigrants from Croatia Percentile | Sample Size | Self-Care Disability |
[ 0.0% - 0.5% ] 0.010% | 53,227,368 | 2.4% |
[ 0.0% - 0.5% ] 0.031% | 32,238,248 | 2.5% |
[ 0.0% - 0.5% ] 0.049% | 22,841,552 | 2.6% |
[ 0.0% - 0.5% ] 0.077% | 6,961,575 | 2.2% |
[ 0.0% - 0.5% ] 0.098% | 5,243,750 | 2.2% |
[ 0.0% - 0.5% ] 0.12% | 2,516,308 | 2.3% |
[ 0.0% - 0.5% ] 0.14% | 1,624,604 | 2.4% |
[ 0.0% - 0.5% ] 0.16% | 1,325,015 | 2.3% |
[ 0.0% - 0.5% ] 0.19% | 1,122,364 | 2.3% |
[ 0.0% - 0.5% ] 0.21% | 545,986 | 2.4% |
[ 0.0% - 0.5% ] 0.23% | 769,935 | 2.6% |
[ 0.0% - 0.5% ] 0.25% | 589,204 | 2.4% |
[ 0.0% - 0.5% ] 0.27% | 483,070 | 2.5% |
[ 0.0% - 0.5% ] 0.30% | 341,651 | 3.3% |
[ 0.0% - 0.5% ] 0.32% | 227,065 | 2.7% |
[ 0.0% - 0.5% ] 0.34% | 318,257 | 2.4% |
[ 0.0% - 0.5% ] 0.36% | 200,157 | 2.6% |
[ 0.0% - 0.5% ] 0.39% | 208,826 | 2.0% |
[ 0.0% - 0.5% ] 0.41% | 65,108 | 3.9% |
[ 0.0% - 0.5% ] 0.43% | 159,676 | 2.4% |
[ 0.0% - 0.5% ] 0.45% | 135,542 | 2.5% |
[ 0.0% - 0.5% ] 0.48% | 119,493 | 2.1% |
[ 0.0% - 0.5% ] 0.49% | 164,910 | 2.5% |
[ 0.5% - 1.0% ] 0.52% | 77,634 | 1.8% |
[ 0.5% - 1.0% ] 0.54% | 40,579 | 1.8% |
[ 0.5% - 1.0% ] 0.56% | 83,552 | 2.3% |
[ 0.5% - 1.0% ] 0.59% | 80,692 | 3.2% |
[ 0.5% - 1.0% ] 0.61% | 14,359 | 2.0% |
[ 0.5% - 1.0% ] 0.63% | 87,443 | 1.9% |
[ 0.5% - 1.0% ] 0.65% | 30,057 | 3.3% |
[ 0.5% - 1.0% ] 0.67% | 56,899 | 2.5% |
[ 0.5% - 1.0% ] 0.70% | 38,116 | 2.5% |
[ 0.5% - 1.0% ] 0.73% | 4,536 | 1.6% |
[ 0.5% - 1.0% ] 0.74% | 6,785 | 2.7% |
[ 0.5% - 1.0% ] 0.76% | 47,950 | 1.9% |
[ 0.5% - 1.0% ] 0.78% | 62,212 | 1.4% |
[ 0.5% - 1.0% ] 0.80% | 9,073 | 3.7% |
[ 0.5% - 1.0% ] 0.83% | 31,458 | 2.4% |
[ 0.5% - 1.0% ] 0.87% | 52,121 | 1.8% |
[ 0.5% - 1.0% ] 0.92% | 35,889 | 2.6% |
[ 0.5% - 1.0% ] 0.96% | 20,996 | 5.4% |
[ 0.5% - 1.0% ] 0.99% | 6,380 | 3.4% |
[ 1.0% - 1.5% ] 1.03% | 486 | 3.2% |
[ 1.0% - 1.5% ] 1.06% | 470 | 3.9% |
[ 1.0% - 1.5% ] 1.08% | 3,966 | 2.1% |
[ 1.0% - 1.5% ] 1.11% | 17,625 | 2.5% |
[ 1.0% - 1.5% ] 1.13% | 3,999 | 1.9% |
[ 1.0% - 1.5% ] 1.15% | 34,752 | 1.6% |
[ 1.0% - 1.5% ] 1.20% | 1,254 | 1.7% |
[ 1.0% - 1.5% ] 1.25% | 38,209 | 2.1% |
[ 1.0% - 1.5% ] 1.29% | 5,496 | 0.94% |
[ 1.0% - 1.5% ] 1.31% | 70,431 | 1.6% |
[ 1.0% - 1.5% ] 1.34% | 34,539 | 1.9% |
[ 1.0% - 1.5% ] 1.35% | 2,444 | 2.2% |
[ 1.0% - 1.5% ] 1.38% | 362 | 1.1% |
[ 1.0% - 1.5% ] 1.41% | 8,801 | 2.1% |
[ 1.0% - 1.5% ] 1.50% | 2,739 | 3.0% |
[ 1.5% - 2.0% ] 1.52% | 330 | 3.8% |
[ 1.5% - 2.0% ] 1.53% | 1,374 | 0.59% |
[ 1.5% - 2.0% ] 1.55% | 1,875 | 2.7% |
[ 1.5% - 2.0% ] 1.57% | 24,440 | 2.5% |
[ 1.5% - 2.0% ] 1.60% | 811 | 2.1% |
[ 1.5% - 2.0% ] 1.63% | 307 | 2.5% |
[ 1.5% - 2.0% ] 1.65% | 910 | 1.8% |
[ 1.5% - 2.0% ] 1.78% | 8,804 | 0.93% |
[ 1.5% - 2.0% ] 1.79% | 20,401 | 2.6% |
[ 1.5% - 2.0% ] 1.85% | 6,914 | 2.3% |
[ 2.0% - 2.5% ] 2.00% | 6,590 | 1.0% |
[ 2.0% - 2.5% ] 2.32% | 29,870 | 3.3% |
[ 2.0% - 2.5% ] 2.45% | 286 | 1.8% |
[ 2.5% - 3.0% ] 2.78% | 2,442 | 1.3% |
[ 2.5% - 3.0% ] 2.91% | 172 | 4.6% |
[ 10.0% - 10.5% ] 10.30% | 398 | 2.8% |