Scotch-Irish Median Female Earnings
COMPARE
Scotch-Irish
Select to Compare
Median Female Earnings
Scotch-Irish Median Female Earnings
$37,383
EARNINGS | FEMALES
0.8/ 100
METRIC RATING
259th/ 347
METRIC RANK
Scotch-Irish Median Female Earnings Correlation Chart
The statistical analysis conducted on geographies consisting of 547,379,253 people shows a poor positive correlation between the proportion of Scotch-Irish and median female earnings in the United States with a correlation coefficient (R) of 0.184 and weighted average of $37,383. On average, for every 1% (one percent) increase in Scotch-Irish within a typical geography, there is an increase of $199 in median female earnings.
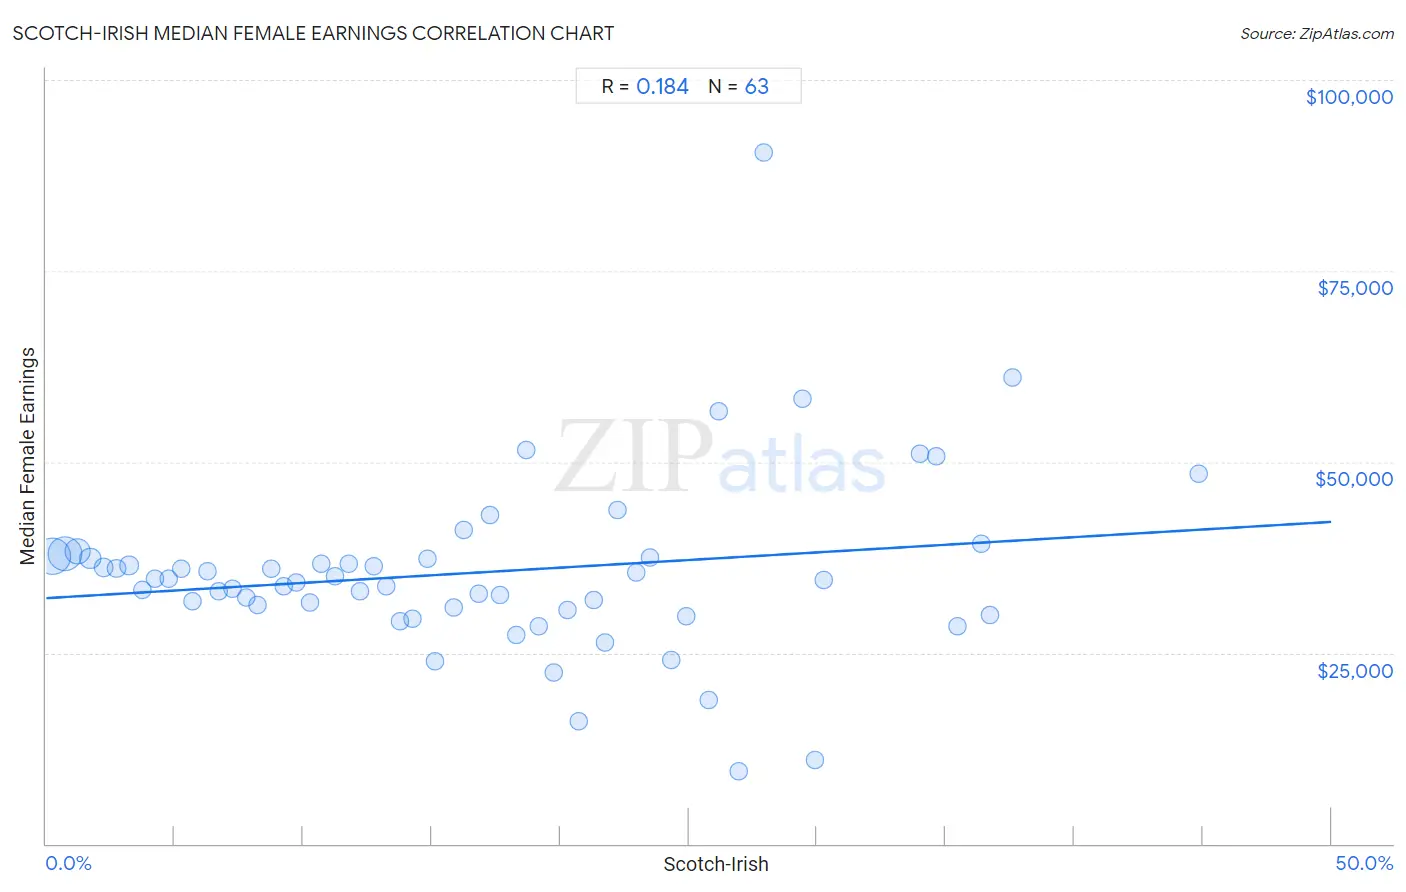
It is essential to understand that the correlation between the percentage of Scotch-Irish and median female earnings does not imply a direct cause-and-effect relationship. It remains uncertain whether the presence of Scotch-Irish influences an upward or downward trend in the level of median female earnings within an area, or if Scotch-Irish simply ended up residing in those areas with higher or lower levels of median female earnings due to other factors.
Demographics Similar to Scotch-Irish by Median Female Earnings
In terms of median female earnings, the demographic groups most similar to Scotch-Irish are Belizean ($37,429, a difference of 0.12%), Dutch ($37,339, a difference of 0.12%), Malaysian ($37,298, a difference of 0.23%), Venezuelan ($37,282, a difference of 0.27%), and Samoan ($37,498, a difference of 0.31%).
| Demographics | Rating | Rank | Median Female Earnings |
| Immigrants from Dominica | 2.0 /100 | #252 | Tragic $37,825 |
| Danes | 1.6 /100 | #253 | Tragic $37,730 |
| Whites/Caucasians | 1.1 /100 | #254 | Tragic $37,531 |
| Colville | 1.1 /100 | #255 | Tragic $37,514 |
| Samoans | 1.0 /100 | #256 | Tragic $37,498 |
| Hawaiians | 1.0 /100 | #257 | Tragic $37,497 |
| Belizeans | 0.9 /100 | #258 | Tragic $37,429 |
| Scotch-Irish | 0.8 /100 | #259 | Tragic $37,383 |
| Dutch | 0.7 /100 | #260 | Tragic $37,339 |
| Malaysians | 0.7 /100 | #261 | Tragic $37,298 |
| Venezuelans | 0.7 /100 | #262 | Tragic $37,282 |
| German Russians | 0.5 /100 | #263 | Tragic $37,105 |
| Salvadorans | 0.4 /100 | #264 | Tragic $37,083 |
| Immigrants from Belize | 0.4 /100 | #265 | Tragic $37,056 |
| Dominicans | 0.4 /100 | #266 | Tragic $37,046 |
Scotch-Irish Median Female Earnings Correlation Summary
| Measurement | Scotch-Irish Data | Median Female Earnings Data |
| Minimum | 0.25% | $9,426 |
| Maximum | 44.8% | $90,469 |
| Range | 44.6% | $81,043 |
| Mean | 16.8% | $35,513 |
| Median | 15.9% | $34,550 |
| Interquartile 25% (IQ1) | 7.8% | $30,536 |
| Interquartile 75% (IQ3) | 24.3% | $37,534 |
| Interquartile Range (IQR) | 16.6% | $6,998 |
| Standard Deviation (Sample) | 10.9% | $11,827 |
| Standard Deviation (Population) | 10.8% | $11,733 |
Correlation Details
| Scotch-Irish Percentile | Sample Size | Median Female Earnings |
[ 0.0% - 0.5% ] 0.25% | 210,585,162 | $37,676 |
[ 0.5% - 1.0% ] 0.72% | 182,971,064 | $38,043 |
[ 1.0% - 1.5% ] 1.21% | 82,552,021 | $38,295 |
[ 1.5% - 2.0% ] 1.72% | 36,350,060 | $37,357 |
[ 2.0% - 2.5% ] 2.21% | 15,809,323 | $36,155 |
[ 2.5% - 3.0% ] 2.73% | 7,787,861 | $36,034 |
[ 3.0% - 3.5% ] 3.23% | 5,071,724 | $36,443 |
[ 3.5% - 4.0% ] 3.75% | 2,421,259 | $33,201 |
[ 4.0% - 4.5% ] 4.25% | 1,232,425 | $34,671 |
[ 4.5% - 5.0% ] 4.76% | 726,502 | $34,776 |
[ 5.0% - 5.5% ] 5.23% | 632,055 | $36,024 |
[ 5.5% - 6.0% ] 5.71% | 301,261 | $31,773 |
[ 6.0% - 6.5% ] 6.29% | 200,268 | $35,689 |
[ 6.5% - 7.0% ] 6.71% | 129,629 | $33,019 |
[ 7.0% - 7.5% ] 7.24% | 107,930 | $33,320 |
[ 7.5% - 8.0% ] 7.79% | 102,387 | $32,296 |
[ 8.0% - 8.5% ] 8.21% | 69,220 | $31,256 |
[ 8.5% - 9.0% ] 8.75% | 57,402 | $36,048 |
[ 9.0% - 9.5% ] 9.24% | 37,534 | $33,759 |
[ 9.5% - 10.0% ] 9.75% | 34,910 | $34,285 |
[ 10.0% - 10.5% ] 10.28% | 34,766 | $31,604 |
[ 10.5% - 11.0% ] 10.70% | 22,170 | $36,622 |
[ 11.0% - 11.5% ] 11.24% | 18,778 | $35,021 |
[ 11.5% - 12.0% ] 11.77% | 14,218 | $36,611 |
[ 12.0% - 12.5% ] 12.22% | 6,892 | $33,134 |
[ 12.5% - 13.0% ] 12.75% | 3,694 | $36,307 |
[ 13.0% - 13.5% ] 13.22% | 18,573 | $33,755 |
[ 13.5% - 14.0% ] 13.75% | 8,533 | $29,195 |
[ 14.0% - 14.5% ] 14.24% | 12,990 | $29,521 |
[ 14.5% - 15.0% ] 14.85% | 2,613 | $37,301 |
[ 15.0% - 15.5% ] 15.12% | 5,005 | $23,875 |
[ 15.5% - 16.0% ] 15.87% | 5,255 | $31,007 |
[ 16.0% - 16.5% ] 16.26% | 7,163 | $41,146 |
[ 16.5% - 17.0% ] 16.81% | 4,652 | $32,801 |
[ 17.0% - 17.5% ] 17.25% | 6,549 | $43,047 |
[ 17.5% - 18.0% ] 17.64% | 7,795 | $32,620 |
[ 18.0% - 18.5% ] 18.31% | 1,764 | $27,398 |
[ 18.5% - 19.0% ] 18.67% | 1,221 | $51,543 |
[ 19.0% - 19.5% ] 19.16% | 929 | $28,417 |
[ 19.5% - 20.0% ] 19.73% | 1,176 | $22,452 |
[ 20.0% - 20.5% ] 20.26% | 464 | $30,536 |
[ 20.5% - 21.0% ] 20.71% | 2,260 | $15,958 |
[ 21.0% - 21.5% ] 21.31% | 582 | $31,842 |
[ 21.5% - 22.0% ] 21.75% | 1,352 | $26,432 |
[ 22.0% - 22.5% ] 22.22% | 18 | $43,750 |
[ 22.5% - 23.0% ] 22.97% | 296 | $35,472 |
[ 23.0% - 23.5% ] 23.48% | 903 | $37,534 |
[ 24.0% - 24.5% ] 24.34% | 189 | $24,079 |
[ 24.5% - 25.0% ] 24.88% | 1,656 | $29,828 |
[ 25.5% - 26.0% ] 25.77% | 163 | $18,750 |
[ 26.0% - 26.5% ] 26.19% | 168 | $56,583 |
[ 26.5% - 27.0% ] 26.92% | 364 | $9,426 |
[ 27.5% - 28.0% ] 27.91% | 86 | $90,469 |
[ 29.0% - 29.5% ] 29.42% | 469 | $58,322 |
[ 29.5% - 30.0% ] 29.91% | 662 | $11,042 |
[ 30.0% - 30.5% ] 30.25% | 2,843 | $34,550 |
[ 34.0% - 34.5% ] 34.01% | 397 | $51,136 |
[ 34.5% - 35.0% ] 34.62% | 234 | $50,755 |
[ 35.0% - 35.5% ] 35.46% | 141 | $28,542 |
[ 36.0% - 36.5% ] 36.40% | 728 | $39,351 |
[ 36.5% - 37.0% ] 36.73% | 49 | $30,000 |
[ 37.5% - 38.0% ] 37.58% | 157 | $61,055 |
[ 44.5% - 45.0% ] 44.84% | 339 | $48,438 |