Scotch-Irish Receiving Food Stamps
COMPARE
Scotch-Irish
Select to Compare
Receiving Food Stamps
Scotch-Irish Receiving Food Stamps
10.5%
PUBLIC INCOME | FOOD STAMPS
95.1/ 100
METRIC RATING
114th/ 347
METRIC RANK
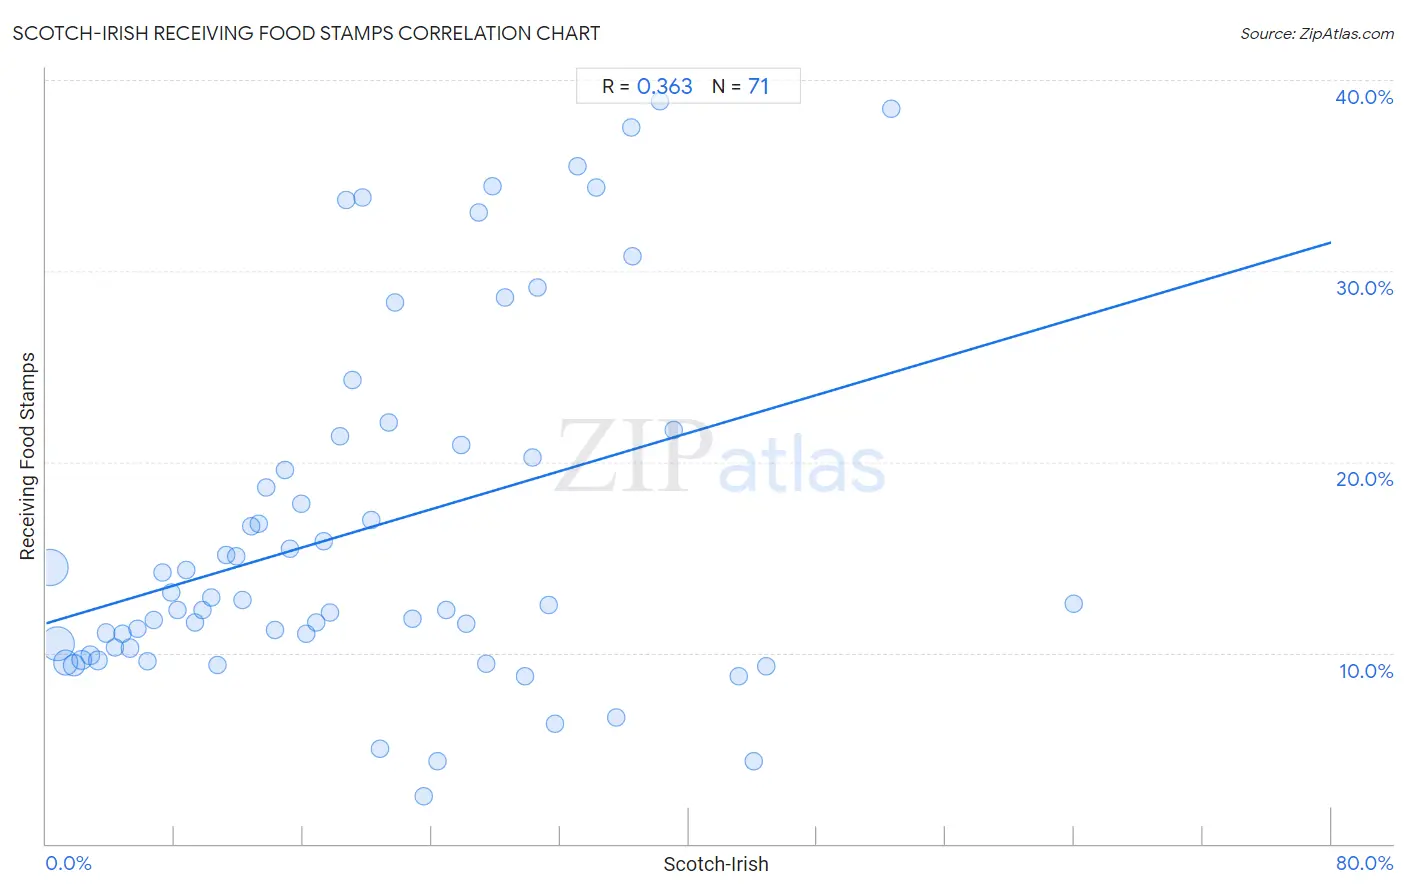
Scotch-Irish Receiving Food Stamps Correlation Chart
The statistical analysis conducted on geographies consisting of 546,022,543 people shows a mild positive correlation between the proportion of Scotch-Irish and percentage of population receiving government assistance and/or food stamps in the United States with a correlation coefficient (R) of 0.363 and weighted average of 10.5%. On average, for every 1% (one percent) increase in Scotch-Irish within a typical geography, there is an increase of 0.25% in percentage of population receiving government assistance and/or food stamps.
It is essential to understand that the correlation between the percentage of Scotch-Irish and percentage of population receiving government assistance and/or food stamps does not imply a direct cause-and-effect relationship. It remains uncertain whether the presence of Scotch-Irish influences an upward or downward trend in the level of percentage of population receiving government assistance and/or food stamps within an area, or if Scotch-Irish simply ended up residing in those areas with higher or lower levels of percentage of population receiving government assistance and/or food stamps due to other factors.
Demographics Similar to Scotch-Irish by Receiving Food Stamps
In terms of receiving food stamps, the demographic groups most similar to Scotch-Irish are Immigrants from Saudi Arabia (10.5%, a difference of 0.18%), Canadian (10.5%, a difference of 0.22%), Icelander (10.5%, a difference of 0.30%), Immigrants from Nepal (10.6%, a difference of 0.39%), and Mongolian (10.5%, a difference of 0.68%).
| Demographics | Rating | Rank | Receiving Food Stamps |
| Koreans | 96.3 /100 | #107 | Exceptional 10.4% |
| Carpatho Rusyns | 96.2 /100 | #108 | Exceptional 10.4% |
| Immigrants from Pakistan | 96.2 /100 | #109 | Exceptional 10.4% |
| Pakistanis | 95.9 /100 | #110 | Exceptional 10.4% |
| Romanians | 95.8 /100 | #111 | Exceptional 10.4% |
| Mongolians | 95.8 /100 | #112 | Exceptional 10.5% |
| Icelanders | 95.4 /100 | #113 | Exceptional 10.5% |
| Scotch-Irish | 95.1 /100 | #114 | Exceptional 10.5% |
| Immigrants from Saudi Arabia | 94.9 /100 | #115 | Exceptional 10.5% |
| Canadians | 94.8 /100 | #116 | Exceptional 10.5% |
| Immigrants from Nepal | 94.6 /100 | #117 | Exceptional 10.6% |
| Assyrians/Chaldeans/Syriacs | 94.1 /100 | #118 | Exceptional 10.6% |
| Immigrants from Poland | 93.9 /100 | #119 | Exceptional 10.6% |
| Ethiopians | 93.9 /100 | #120 | Exceptional 10.6% |
| Slavs | 93.8 /100 | #121 | Exceptional 10.6% |
Scotch-Irish Receiving Food Stamps Correlation Summary
| Measurement | Scotch-Irish Data | Receiving Food Stamps Data |
| Minimum | 0.25% | 2.5% |
| Maximum | 64.0% | 38.9% |
| Range | 63.7% | 36.4% |
| Mean | 19.7% | 16.4% |
| Median | 17.7% | 12.6% |
| Interquartile 25% (IQ1) | 8.7% | 10.2% |
| Interquartile 75% (IQ3) | 28.6% | 20.9% |
| Interquartile Range (IQR) | 19.9% | 10.7% |
| Standard Deviation (Sample) | 13.6% | 9.3% |
| Standard Deviation (Population) | 13.5% | 9.2% |
Correlation Details
| Scotch-Irish Percentile | Sample Size | Receiving Food Stamps |
[ 0.0% - 0.5% ] 0.25% | 209,961,918 | 14.5% |
[ 0.5% - 1.0% ] 0.72% | 182,528,639 | 10.5% |
[ 1.0% - 1.5% ] 1.21% | 82,315,081 | 9.5% |
[ 1.5% - 2.0% ] 1.72% | 36,281,738 | 9.3% |
[ 2.0% - 2.5% ] 2.21% | 15,774,910 | 9.6% |
[ 2.5% - 3.0% ] 2.73% | 7,788,090 | 9.9% |
[ 3.0% - 3.5% ] 3.23% | 5,097,113 | 9.6% |
[ 3.5% - 4.0% ] 3.75% | 2,409,743 | 11.0% |
[ 4.0% - 4.5% ] 4.25% | 1,240,336 | 10.3% |
[ 4.5% - 5.0% ] 4.76% | 730,956 | 11.0% |
[ 5.0% - 5.5% ] 5.23% | 619,879 | 10.2% |
[ 5.5% - 6.0% ] 5.71% | 313,630 | 11.3% |
[ 6.0% - 6.5% ] 6.29% | 199,305 | 9.6% |
[ 6.5% - 7.0% ] 6.71% | 131,378 | 11.7% |
[ 7.0% - 7.5% ] 7.23% | 110,508 | 14.2% |
[ 7.5% - 8.0% ] 7.78% | 101,003 | 13.1% |
[ 8.0% - 8.5% ] 8.21% | 72,562 | 12.3% |
[ 8.5% - 9.0% ] 8.71% | 49,468 | 14.4% |
[ 9.0% - 9.5% ] 9.24% | 37,391 | 11.6% |
[ 9.5% - 10.0% ] 9.76% | 37,254 | 12.2% |
[ 10.0% - 10.5% ] 10.27% | 36,890 | 12.9% |
[ 10.5% - 11.0% ] 10.68% | 23,095 | 9.4% |
[ 11.0% - 11.5% ] 11.23% | 15,666 | 15.1% |
[ 11.5% - 12.0% ] 11.81% | 15,948 | 15.0% |
[ 12.0% - 12.5% ] 12.22% | 8,322 | 12.8% |
[ 12.5% - 13.0% ] 12.75% | 4,258 | 16.6% |
[ 13.0% - 13.5% ] 13.22% | 17,785 | 16.7% |
[ 13.5% - 14.0% ] 13.71% | 15,884 | 18.6% |
[ 14.0% - 14.5% ] 14.25% | 15,352 | 11.2% |
[ 14.5% - 15.0% ] 14.83% | 2,529 | 19.6% |
[ 15.0% - 15.5% ] 15.17% | 6,078 | 15.5% |
[ 15.5% - 16.0% ] 15.86% | 5,177 | 17.8% |
[ 16.0% - 16.5% ] 16.21% | 10,492 | 11.0% |
[ 16.5% - 17.0% ] 16.81% | 4,776 | 11.6% |
[ 17.0% - 17.5% ] 17.25% | 5,728 | 15.8% |
[ 17.5% - 18.0% ] 17.66% | 9,586 | 12.1% |
[ 18.0% - 18.5% ] 18.30% | 2,164 | 21.4% |
[ 18.5% - 19.0% ] 18.65% | 2,970 | 33.7% |
[ 19.0% - 19.5% ] 19.03% | 557 | 24.3% |
[ 19.5% - 20.0% ] 19.71% | 1,157 | 33.8% |
[ 20.0% - 20.5% ] 20.27% | 597 | 16.9% |
[ 20.5% - 21.0% ] 20.79% | 1,539 | 5.0% |
[ 21.0% - 21.5% ] 21.34% | 731 | 22.1% |
[ 21.5% - 22.0% ] 21.68% | 1,033 | 28.3% |
[ 22.5% - 23.0% ] 22.77% | 1,256 | 11.8% |
[ 23.0% - 23.5% ] 23.48% | 903 | 2.5% |
[ 24.0% - 24.5% ] 24.34% | 189 | 4.3% |
[ 24.5% - 25.0% ] 24.88% | 1,716 | 12.2% |
[ 25.5% - 26.0% ] 25.83% | 724 | 20.9% |
[ 26.0% - 26.5% ] 26.16% | 237 | 11.5% |
[ 26.5% - 27.0% ] 26.91% | 431 | 33.1% |
[ 27.0% - 27.5% ] 27.40% | 208 | 9.4% |
[ 27.5% - 28.0% ] 27.78% | 144 | 34.5% |
[ 28.5% - 29.0% ] 28.57% | 7 | 28.6% |
[ 29.5% - 30.0% ] 29.83% | 905 | 8.8% |
[ 30.0% - 30.5% ] 30.24% | 2,609 | 20.2% |
[ 30.5% - 31.0% ] 30.57% | 386 | 29.1% |
[ 31.0% - 31.5% ] 31.25% | 32 | 12.5% |
[ 31.5% - 32.0% ] 31.65% | 79 | 6.3% |
[ 33.0% - 33.5% ] 33.06% | 121 | 35.5% |
[ 34.0% - 34.5% ] 34.22% | 450 | 34.4% |
[ 35.0% - 35.5% ] 35.46% | 141 | 6.6% |
[ 36.0% - 36.5% ] 36.40% | 728 | 37.5% |
[ 36.5% - 37.0% ] 36.51% | 556 | 30.8% |
[ 38.0% - 38.5% ] 38.18% | 55 | 38.9% |
[ 39.0% - 39.5% ] 39.08% | 87 | 21.7% |
[ 43.0% - 43.5% ] 43.13% | 473 | 8.8% |
[ 44.0% - 44.5% ] 44.08% | 338 | 4.3% |
[ 44.5% - 45.0% ] 44.84% | 339 | 9.3% |
[ 52.5% - 53.0% ] 52.63% | 38 | 38.5% |
[ 64.0% - 64.5% ] 64.00% | 175 | 12.6% |