Icelander Self-Care Disability

COMPARE

Icelander
Race
Ancestry
AfghanAfricanAlaska NativeAlaskan AthabascanAlbanianAleutAlsatianAmericanApacheArabArapahoArgentineanArmenianAssyrian/Chaldean/SyriacAustralianAustrianBahamianBangladeshiBarbadianBasqueBelgianBelizeanBermudanBhutaneseBlackfeetBolivianBrazilianBritishBritish West IndianBulgarianBurmeseCajunCambodianCanadianCape VerdeanCarpatho RusynCelticCentral AmericanCentral American IndianCherokeeCheyenneChickasawChileanChineseChippewaChoctawColombianColvilleComancheCosta RicanCreeCreekCroatianCrowCubanCypriotCzechCzechoslovakianDanishDelawareDominicanDutchDutch West IndianEastern EuropeanEcuadorianEgyptianEnglishEstonianEthiopianEuropeanFijianFilipinoFinnishFrenchFrench American IndianFrench CanadianGermanGerman RussianGhanaianGreekGuamanian/ChamorroGuatemalanGuyaneseHaitianHmongHonduranHopiHoumaHungarianIcelanderIndian (Asian)IndonesianInupiatIranianIraqiIrishIroquoisIsraeliItalianJamaicanJapaneseJordanianKenyanKiowaKoreanLaotianLatvianLebaneseLiberianLithuanianLumbeeLuxembourgerMacedonianMalaysianMalteseMarshalleseMenomineeMexicanMexican American IndianMongolianMoroccanNative HawaiianNavajoNepaleseNew ZealanderNicaraguanNigerianNorthern EuropeanNorwegianOkinawanOsageOttawaPaiutePakistaniPalestinianPanamanianParaguayanPennsylvania GermanPeruvianPimaPolishPortuguesePotawatomiPuebloPuerto RicanPuget Sound SalishRomanianRussianSalvadoranSamoanScandinavianScotch-IrishScottishSeminoleSenegaleseSerbianShoshoneSierra LeoneanSiouxSlavicSlovakSloveneSomaliSouth AfricanSouth AmericanSouth American IndianSoviet UnionSpaniardSpanishSpanish AmericanSpanish American IndianSri LankanSubsaharan AfricanSudaneseSwedishSwissSyrianTaiwaneseThaiTlingit-HaidaTohono O'OdhamTonganTrinidadian and TobagonianTsimshianTurkishU.S. Virgin IslanderUgandanUkrainianUruguayanUteVenezuelanVietnameseWelshWest IndianYakamaYaquiYugoslavianYumanYup'ikZimbabwean
Immigration
NonimmigrantsImmigrantsAfghanistanAfricaAlbaniaArgentinaArmeniaAsiaAustraliaAustriaBahamasBangladeshBarbadosBelarusBelgiumBelizeBoliviaBosnia and HerzegovinaBrazilBulgariaBurma/MyanmarCabo VerdeCambodiaCameroonCanadaCaribbeanCentral AmericaChileChinaColombiaCongoCosta RicaCroatiaCubaCzechoslovakiaDenmarkDominicaDominican RepublicEastern AfricaEastern AsiaEastern EuropeEcuadorEgyptEl SalvadorEnglandEritreaEthiopiaEuropeFijiFranceGermanyGhanaGreeceGrenadaGuatemalaGuyanaHaitiHondurasHong KongHungaryIndiaIndonesiaIranIraqIrelandIsraelItalyJamaicaJapanJordanKazakhstanKenyaKoreaKuwaitLaosLatin AmericaLatviaLebanonLiberiaLithuaniaMalaysiaMexicoMicronesiaMiddle AfricaMoldovaMoroccoNepalNetherlandsNicaraguaNigeriaNorth AmericaNorth MacedoniaNorthern AfricaNorthern EuropeNorwayOceaniaPakistanPanamaPeruPhilippinesPolandPortugalRomaniaRussiaSaudi ArabiaScotlandSenegalSerbiaSierra LeoneSingaporeSomaliaSouth AfricaSouth AmericaSouth Central AsiaSouth Eastern AsiaSouthern EuropeSpainSri LankaSt. Vincent and the GrenadinesSudanSwedenSwitzerlandSyriaTaiwanThailandTrinidad and TobagoTurkeyUgandaUkraineUruguayUzbekistanVenezuelaVietnamWest IndiesWestern AfricaWestern AsiaWestern EuropeYemenZaireZimbabweAzores
Select to Compare
Race
Ancestry
AfghanAfricanAlaska NativeAlaskan AthabascanAlbanianAleutAlsatianAmericanApacheArabArapahoArgentineanArmenianAssyrian/Chaldean/SyriacAustralianAustrianBahamianBangladeshiBarbadianBasqueBelgianBelizeanBermudanBhutaneseBlackfeetBolivianBrazilianBritishBritish West IndianBulgarianBurmeseCajunCambodianCanadianCape VerdeanCarpatho RusynCelticCentral AmericanCentral American IndianCherokeeCheyenneChickasawChileanChineseChippewaChoctawColombianColvilleComancheCosta RicanCreeCreekCroatianCrowCubanCypriotCzechCzechoslovakianDanishDelawareDominicanDutchDutch West IndianEastern EuropeanEcuadorianEgyptianEnglishEstonianEthiopianEuropeanFijianFilipinoFinnishFrenchFrench American IndianFrench CanadianGermanGerman RussianGhanaianGreekGuamanian/ChamorroGuatemalanGuyaneseHaitianHmongHonduranHopiHoumaHungarianIndian (Asian)IndonesianInupiatIranianIraqiIrishIroquoisIsraeliItalianJamaicanJapaneseJordanianKenyanKiowaKoreanLaotianLatvianLebaneseLiberianLithuanianLumbeeLuxembourgerMacedonianMalaysianMalteseMarshalleseMenomineeMexicanMexican American IndianMongolianMoroccanNative HawaiianNavajoNepaleseNew ZealanderNicaraguanNigerianNorthern EuropeanNorwegianOkinawanOsageOttawaPaiutePakistaniPalestinianPanamanianParaguayanPennsylvania GermanPeruvianPimaPolishPortuguesePotawatomiPuebloPuerto RicanPuget Sound SalishRomanianRussianSalvadoranSamoanScandinavianScotch-IrishScottishSeminoleSenegaleseSerbianShoshoneSierra LeoneanSiouxSlavicSlovakSloveneSomaliSouth AfricanSouth AmericanSouth American IndianSoviet UnionSpaniardSpanishSpanish AmericanSpanish American IndianSri LankanSubsaharan AfricanSudaneseSwedishSwissSyrianTaiwaneseThaiTlingit-HaidaTohono O'OdhamTonganTrinidadian and TobagonianTsimshianTurkishU.S. Virgin IslanderUgandanUkrainianUruguayanUteVenezuelanVietnameseWelshWest IndianYakamaYaquiYugoslavianYumanYup'ikZimbabwean
Immigration
NonimmigrantsImmigrantsAfghanistanAfricaAlbaniaArgentinaArmeniaAsiaAustraliaAustriaBahamasBangladeshBarbadosBelarusBelgiumBelizeBoliviaBosnia and HerzegovinaBrazilBulgariaBurma/MyanmarCabo VerdeCambodiaCameroonCanadaCaribbeanCentral AmericaChileChinaColombiaCongoCosta RicaCroatiaCubaCzechoslovakiaDenmarkDominicaDominican RepublicEastern AfricaEastern AsiaEastern EuropeEcuadorEgyptEl SalvadorEnglandEritreaEthiopiaEuropeFijiFranceGermanyGhanaGreeceGrenadaGuatemalaGuyanaHaitiHondurasHong KongHungaryIndiaIndonesiaIranIraqIrelandIsraelItalyJamaicaJapanJordanKazakhstanKenyaKoreaKuwaitLaosLatin AmericaLatviaLebanonLiberiaLithuaniaMalaysiaMexicoMicronesiaMiddle AfricaMoldovaMoroccoNepalNetherlandsNicaraguaNigeriaNorth AmericaNorth MacedoniaNorthern AfricaNorthern EuropeNorwayOceaniaPakistanPanamaPeruPhilippinesPolandPortugalRomaniaRussiaSaudi ArabiaScotlandSenegalSerbiaSierra LeoneSingaporeSomaliaSouth AfricaSouth AmericaSouth Central AsiaSouth Eastern AsiaSouthern EuropeSpainSri LankaSt. Vincent and the GrenadinesSudanSwedenSwitzerlandSyriaTaiwanThailandTrinidad and TobagoTurkeyUgandaUkraineUruguayUzbekistanVenezuelaVietnamWest IndiesWestern AfricaWestern AsiaWestern EuropeYemenZaireZimbabweAzores
Self-Care Disability
Income
Poverty
Unemployment
Labor Participation
Family Structure
Vehicle Availability
Education Level
Disability

Icelander Self-Care Disability
Exceptional

2.4%
SELF-CARE DISABILITY
97.4/ 100
METRIC RATING
92nd/ 347
METRIC RANK

Icelander Self-Care Disability Correlation Chart

The statistical analysis conducted on geographies consisting of 159,567,572 people shows a weak positive correlation between the proportion of Icelanders and percentage of population with self-care disability in the United States with a correlation coefficient (R) of 0.252 and weighted average of 2.4%. On average, for every 1% (one percent) increase in Icelanders within a typical geography, there is an increase of 0.090% in percentage of population with self-care disability.
Icelander Self-Care Disability
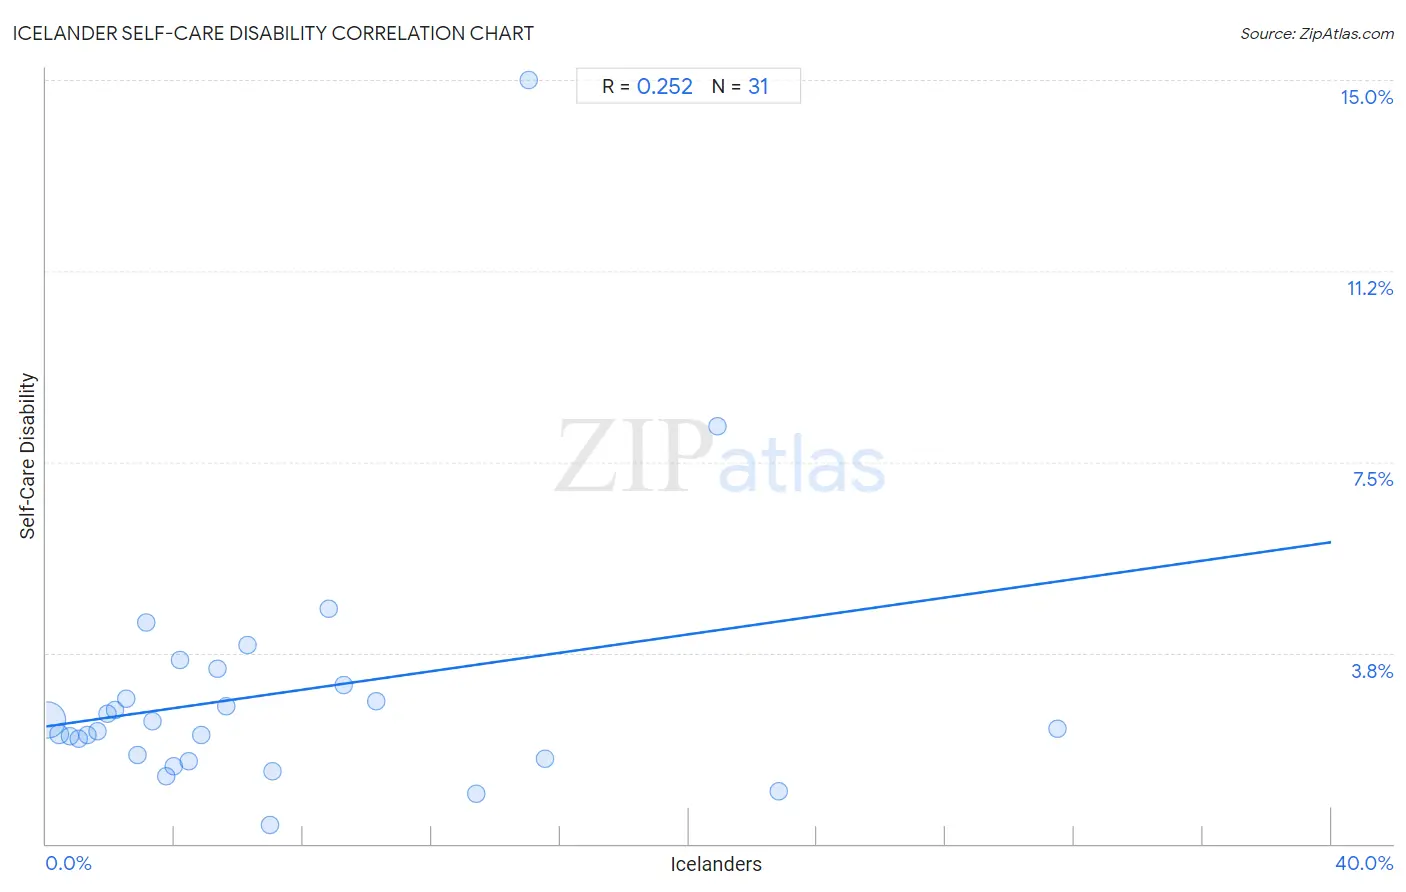
It is essential to understand that the correlation between the percentage of Icelanders and percentage of population with self-care disability does not imply a direct cause-and-effect relationship. It remains uncertain whether the presence of Icelanders influences an upward or downward trend in the level of percentage of population with self-care disability within an area, or if Icelanders simply ended up residing in those areas with higher or lower levels of percentage of population with self-care disability due to other factors.

Demographics Similar to Icelanders by Self-Care Disability

In terms of self-care disability, the demographic groups most similar to Icelanders are Immigrants from Jordan (2.4%, a difference of 0.14%), Immigrants from Czechoslovakia (2.4%, a difference of 0.15%), Immigrants from Latvia (2.4%, a difference of 0.19%), Macedonian (2.4%, a difference of 0.24%), and Immigrants from Asia (2.4%, a difference of 0.25%).
DemographicsRating | RankSelf-Care Disability
Estonians
98.3
/100
|
#85
Exceptional
2.3%
Immigrants from Northern Africa
98.2
/100
|
#86
Exceptional
2.3%
Sierra Leoneans
98.0
/100
|
#87
Exceptional
2.4%
Lithuanians
98.0
/100
|
#88
Exceptional
2.4%
Immigrants from Congo
98.0
/100
|
#89
Exceptional
2.4%
Immigrants from Czechoslovakia
97.7
/100
|
#90
Exceptional
2.4%
Immigrants from Jordan
97.7
/100
|
#91
Exceptional
2.4%
Icelanders
97.4
/100
|
#92
Exceptional
2.4%
Immigrants from Latvia
97.0
/100
|
#93
Exceptional
2.4%
Macedonians
96.9
/100
|
#94
Exceptional
2.4%
Immigrants from Asia
96.9
/100
|
#95
Exceptional
2.4%
Immigrants from Chile
96.7
/100
|
#96
Exceptional
2.4%
Swiss
96.6
/100
|
#97
Exceptional
2.4%
Immigrants from Poland
96.4
/100
|
#98
Exceptional
2.4%
Immigrants from Israel
96.1
/100
|
#99
Exceptional
2.4%

Icelander Self-Care Disability Correlation Summary

MeasurementIcelander DataSelf-Care Disability Data
Minimum0.041%0.38%
Maximum31.5%15.0%
Range31.4%14.6%
Mean7.1%2.9%
Median4.4%2.3%
Interquartile 25% (IQ1)2.1%1.7%
Interquartile 75% (IQ3)9.3%3.1%
Interquartile Range (IQR)7.1%1.4%
Standard Deviation (Sample)7.4%2.6%
Standard Deviation (Population)7.2%2.6%

Correlation Details

Icelander PercentileSample SizeSelf-Care Disability
[
0.0%
-
0.5%
]
0.041%
155,018,8692.4%
[
0.0%
-
0.5%
]
0.41%
3,258,9592.2%
[
0.5%
-
1.0%
]
0.74%
697,8532.1%
[
0.5%
-
1.0%
]
1.00%
322,3892.1%
[
1.0%
-
1.5%
]
1.29%
103,1332.1%
[
1.5%
-
2.0%
]
1.59%
63,3072.2%
[
1.5%
-
2.0%
]
1.89%
29,6982.6%
[
2.0%
-
2.5%
]
2.13%
23,1182.6%
[
2.5%
-
3.0%
]
2.50%
6,1532.9%
[
2.5%
-
3.0%
]
2.83%
12,7091.7%
[
3.0%
-
3.5%
]
3.12%
5,5194.3%
[
3.0%
-
3.5%
]
3.30%
1,5442.4%
[
3.5%
-
4.0%
]
3.75%
8011.3%
[
3.5%
-
4.0%
]
3.98%
4,6201.5%
[
4.0%
-
4.5%
]
4.18%
1,4363.6%
[
4.0%
-
4.5%
]
4.45%
2,0691.6%
[
4.5%
-
5.0%
]
4.82%
5812.1%
[
5.0%
-
5.5%
]
5.31%
5083.4%
[
5.5%
-
6.0%
]
5.60%
5,3612.7%
[
6.0%
-
6.5%
]
6.28%
2,3573.9%
[
6.5%
-
7.0%
]
6.95%
5610.38%
[
7.0%
-
7.5%
]
7.05%
2271.4%
[
8.5%
-
9.0%
]
8.81%
1594.6%
[
9.0%
-
9.5%
]
9.26%
1,3603.1%
[
10.0%
-
10.5%
]
10.25%
2,2042.8%
[
13.0%
-
13.5%
]
13.40%
2090.99%
[
15.0%
-
15.5%
]
15.00%
2015.0%
[
15.5%
-
16.0%
]
15.52%
1161.7%
[
20.5%
-
21.0%
]
20.90%
2448.2%
[
22.5%
-
23.0%
]
22.80%
5351.0%
[
31.0%
-
31.5%
]
31.48%
9532.3%