Basque Self-Care Disability
COMPARE
Basque
Select to Compare
Self-Care Disability
Basque Self-Care Disability
2.4%
SELF-CARE DISABILITY
74.0/ 100
METRIC RATING
151st/ 347
METRIC RANK
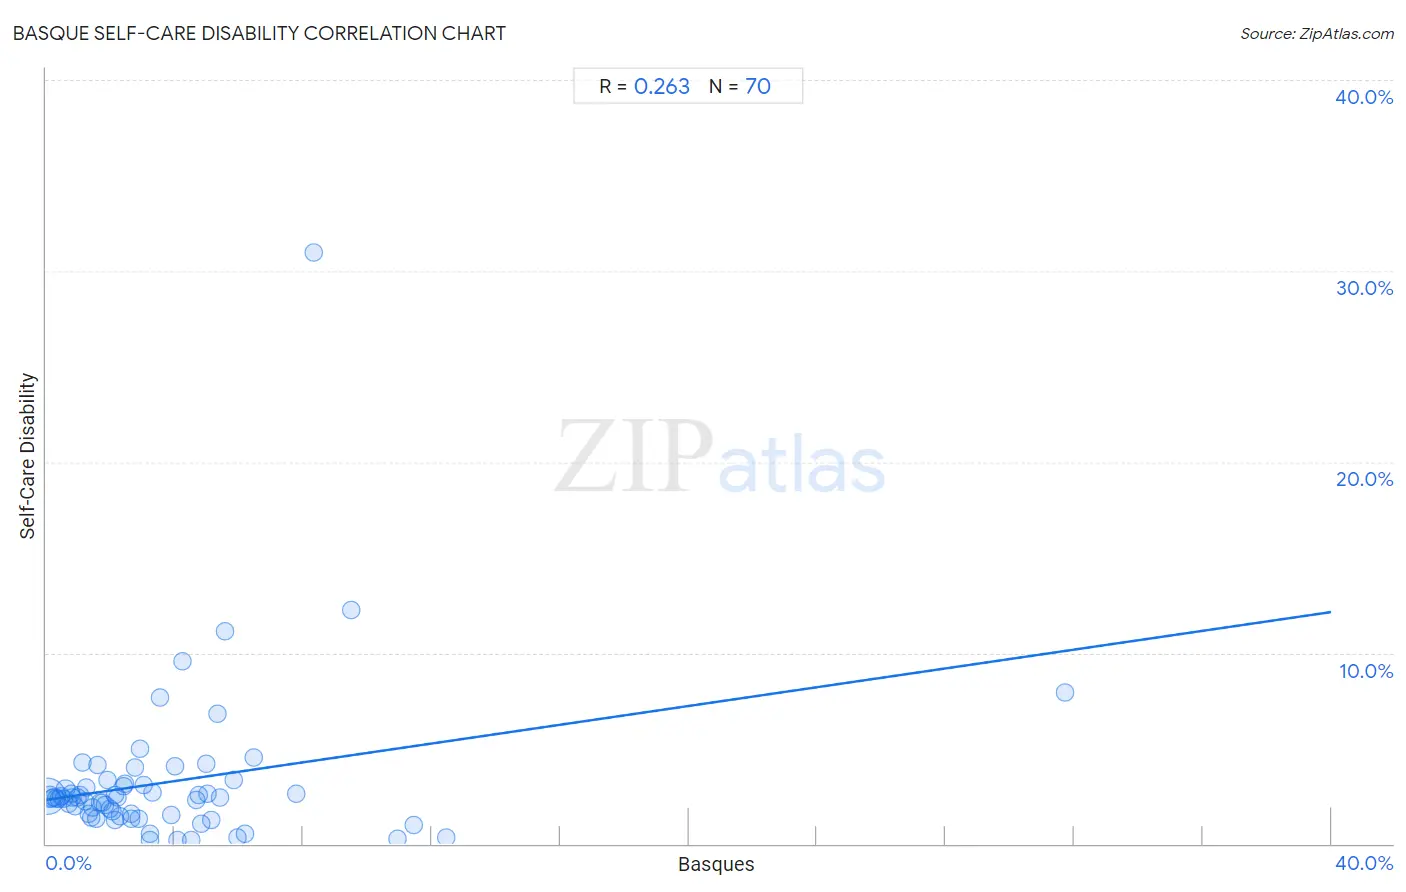
Basque Self-Care Disability Correlation Chart
The statistical analysis conducted on geographies consisting of 165,703,684 people shows a weak positive correlation between the proportion of Basques and percentage of population with self-care disability in the United States with a correlation coefficient (R) of 0.263 and weighted average of 2.4%. On average, for every 1% (one percent) increase in Basques within a typical geography, there is an increase of 0.25% in percentage of population with self-care disability.
It is essential to understand that the correlation between the percentage of Basques and percentage of population with self-care disability does not imply a direct cause-and-effect relationship. It remains uncertain whether the presence of Basques influences an upward or downward trend in the level of percentage of population with self-care disability within an area, or if Basques simply ended up residing in those areas with higher or lower levels of percentage of population with self-care disability due to other factors.
Demographics Similar to Basques by Self-Care Disability
In terms of self-care disability, the demographic groups most similar to Basques are Tlingit-Haida (2.4%, a difference of 0.030%), Immigrants from England (2.4%, a difference of 0.030%), Immigrants from Costa Rica (2.4%, a difference of 0.070%), Arab (2.4%, a difference of 0.11%), and Italian (2.4%, a difference of 0.11%).
| Demographics | Rating | Rank | Self-Care Disability |
| Costa Ricans | 80.8 /100 | #144 | Excellent 2.4% |
| Germans | 80.1 /100 | #145 | Excellent 2.4% |
| Israelis | 80.0 /100 | #146 | Good 2.4% |
| Dutch | 77.5 /100 | #147 | Good 2.4% |
| Romanians | 75.8 /100 | #148 | Good 2.4% |
| Arabs | 75.7 /100 | #149 | Good 2.4% |
| Immigrants from Costa Rica | 75.1 /100 | #150 | Good 2.4% |
| Basques | 74.0 /100 | #151 | Good 2.4% |
| Tlingit-Haida | 73.5 /100 | #152 | Good 2.4% |
| Immigrants from England | 73.5 /100 | #153 | Good 2.4% |
| Italians | 72.2 /100 | #154 | Good 2.4% |
| Pakistanis | 71.4 /100 | #155 | Good 2.4% |
| Nigerians | 70.6 /100 | #156 | Good 2.4% |
| Immigrants from Europe | 69.6 /100 | #157 | Good 2.4% |
| Immigrants from Western Europe | 68.6 /100 | #158 | Good 2.4% |
Basque Self-Care Disability Correlation Summary
| Measurement | Basque Data | Self-Care Disability Data |
| Minimum | 0.025% | 0.19% |
| Maximum | 31.7% | 31.0% |
| Range | 31.7% | 30.8% |
| Mean | 3.7% | 3.2% |
| Median | 2.5% | 2.4% |
| Interquartile 25% (IQ1) | 1.3% | 1.5% |
| Interquartile 75% (IQ3) | 4.8% | 3.1% |
| Interquartile Range (IQR) | 3.6% | 1.5% |
| Standard Deviation (Sample) | 4.4% | 4.1% |
| Standard Deviation (Population) | 4.3% | 4.1% |
Correlation Details
| Basque Percentile | Sample Size | Self-Care Disability |
[ 0.0% - 0.5% ] 0.025% | 131,621,236 | 2.5% |
[ 0.0% - 0.5% ] 0.098% | 18,964,441 | 2.5% |
[ 0.0% - 0.5% ] 0.18% | 6,076,850 | 2.4% |
[ 0.0% - 0.5% ] 0.24% | 3,282,408 | 2.4% |
[ 0.0% - 0.5% ] 0.32% | 1,951,865 | 2.4% |
[ 0.0% - 0.5% ] 0.39% | 845,982 | 2.3% |
[ 0.0% - 0.5% ] 0.46% | 391,918 | 2.5% |
[ 0.5% - 1.0% ] 0.54% | 621,356 | 2.4% |
[ 0.5% - 1.0% ] 0.60% | 310,147 | 2.9% |
[ 0.5% - 1.0% ] 0.69% | 138,735 | 2.1% |
[ 0.5% - 1.0% ] 0.77% | 138,289 | 2.6% |
[ 0.5% - 1.0% ] 0.82% | 78,742 | 2.4% |
[ 0.5% - 1.0% ] 0.90% | 111,672 | 2.0% |
[ 0.5% - 1.0% ] 0.97% | 174,069 | 2.4% |
[ 1.0% - 1.5% ] 1.06% | 52,451 | 2.5% |
[ 1.0% - 1.5% ] 1.11% | 15,591 | 4.2% |
[ 1.0% - 1.5% ] 1.19% | 376,623 | 2.3% |
[ 1.0% - 1.5% ] 1.25% | 88,951 | 3.0% |
[ 1.0% - 1.5% ] 1.32% | 51,018 | 1.6% |
[ 1.0% - 1.5% ] 1.41% | 28,566 | 1.4% |
[ 1.0% - 1.5% ] 1.46% | 32,854 | 1.9% |
[ 1.5% - 2.0% ] 1.54% | 16,594 | 1.3% |
[ 1.5% - 2.0% ] 1.60% | 36,754 | 4.2% |
[ 1.5% - 2.0% ] 1.67% | 51,828 | 2.1% |
[ 1.5% - 2.0% ] 1.75% | 18,087 | 2.1% |
[ 1.5% - 2.0% ] 1.83% | 43,183 | 2.0% |
[ 1.5% - 2.0% ] 1.89% | 11,282 | 3.3% |
[ 1.5% - 2.0% ] 1.97% | 12,219 | 1.8% |
[ 2.0% - 2.5% ] 2.05% | 26,023 | 1.7% |
[ 2.0% - 2.5% ] 2.13% | 1,924 | 2.6% |
[ 2.0% - 2.5% ] 2.16% | 3,943 | 1.3% |
[ 2.0% - 2.5% ] 2.22% | 676 | 2.4% |
[ 2.0% - 2.5% ] 2.30% | 44,711 | 1.5% |
[ 2.0% - 2.5% ] 2.41% | 1,244 | 3.0% |
[ 2.0% - 2.5% ] 2.45% | 13,351 | 3.1% |
[ 2.5% - 3.0% ] 2.63% | 4,594 | 1.6% |
[ 2.5% - 3.0% ] 2.66% | 6,324 | 1.3% |
[ 2.5% - 3.0% ] 2.78% | 3,673 | 4.0% |
[ 2.5% - 3.0% ] 2.89% | 3,360 | 1.3% |
[ 2.5% - 3.0% ] 2.94% | 4,664 | 4.9% |
[ 3.0% - 3.5% ] 3.05% | 131 | 3.1% |
[ 3.0% - 3.5% ] 3.21% | 498 | 0.23% |
[ 3.0% - 3.5% ] 3.24% | 9,217 | 0.54% |
[ 3.0% - 3.5% ] 3.32% | 1,325 | 2.7% |
[ 3.5% - 4.0% ] 3.54% | 254 | 7.7% |
[ 3.5% - 4.0% ] 3.89% | 566 | 1.5% |
[ 4.0% - 4.5% ] 4.02% | 1,665 | 4.1% |
[ 4.0% - 4.5% ] 4.07% | 491 | 0.22% |
[ 4.0% - 4.5% ] 4.26% | 282 | 9.6% |
[ 4.5% - 5.0% ] 4.50% | 1,643 | 0.19% |
[ 4.5% - 5.0% ] 4.68% | 876 | 2.3% |
[ 4.5% - 5.0% ] 4.75% | 1,874 | 2.6% |
[ 4.5% - 5.0% ] 4.81% | 1,122 | 1.1% |
[ 4.5% - 5.0% ] 4.99% | 8,170 | 4.2% |
[ 5.0% - 5.5% ] 5.03% | 2,643 | 2.6% |
[ 5.0% - 5.5% ] 5.13% | 234 | 1.2% |
[ 5.0% - 5.5% ] 5.34% | 356 | 6.8% |
[ 5.0% - 5.5% ] 5.39% | 1,540 | 2.4% |
[ 5.5% - 6.0% ] 5.56% | 18 | 11.1% |
[ 5.5% - 6.0% ] 5.85% | 496 | 3.3% |
[ 5.5% - 6.0% ] 5.95% | 336 | 0.30% |
[ 6.0% - 6.5% ] 6.18% | 3,041 | 0.52% |
[ 6.0% - 6.5% ] 6.47% | 6,169 | 4.5% |
[ 7.5% - 8.0% ] 7.77% | 309 | 2.6% |
[ 8.0% - 8.5% ] 8.33% | 84 | 31.0% |
[ 9.0% - 9.5% ] 9.48% | 211 | 12.3% |
[ 10.5% - 11.0% ] 10.93% | 787 | 0.28% |
[ 11.0% - 11.5% ] 11.43% | 105 | 0.98% |
[ 12.0% - 12.5% ] 12.46% | 690 | 0.33% |
[ 31.5% - 32.0% ] 31.73% | 353 | 7.9% |