Yup'ik Self-Care Disability
COMPARE
Yup'ik
Select to Compare
Self-Care Disability
Yup'ik Self-Care Disability
1.9%
SELF-CARE DISABILITY
100.0/ 100
METRIC RATING
1st/ 347
METRIC RANK
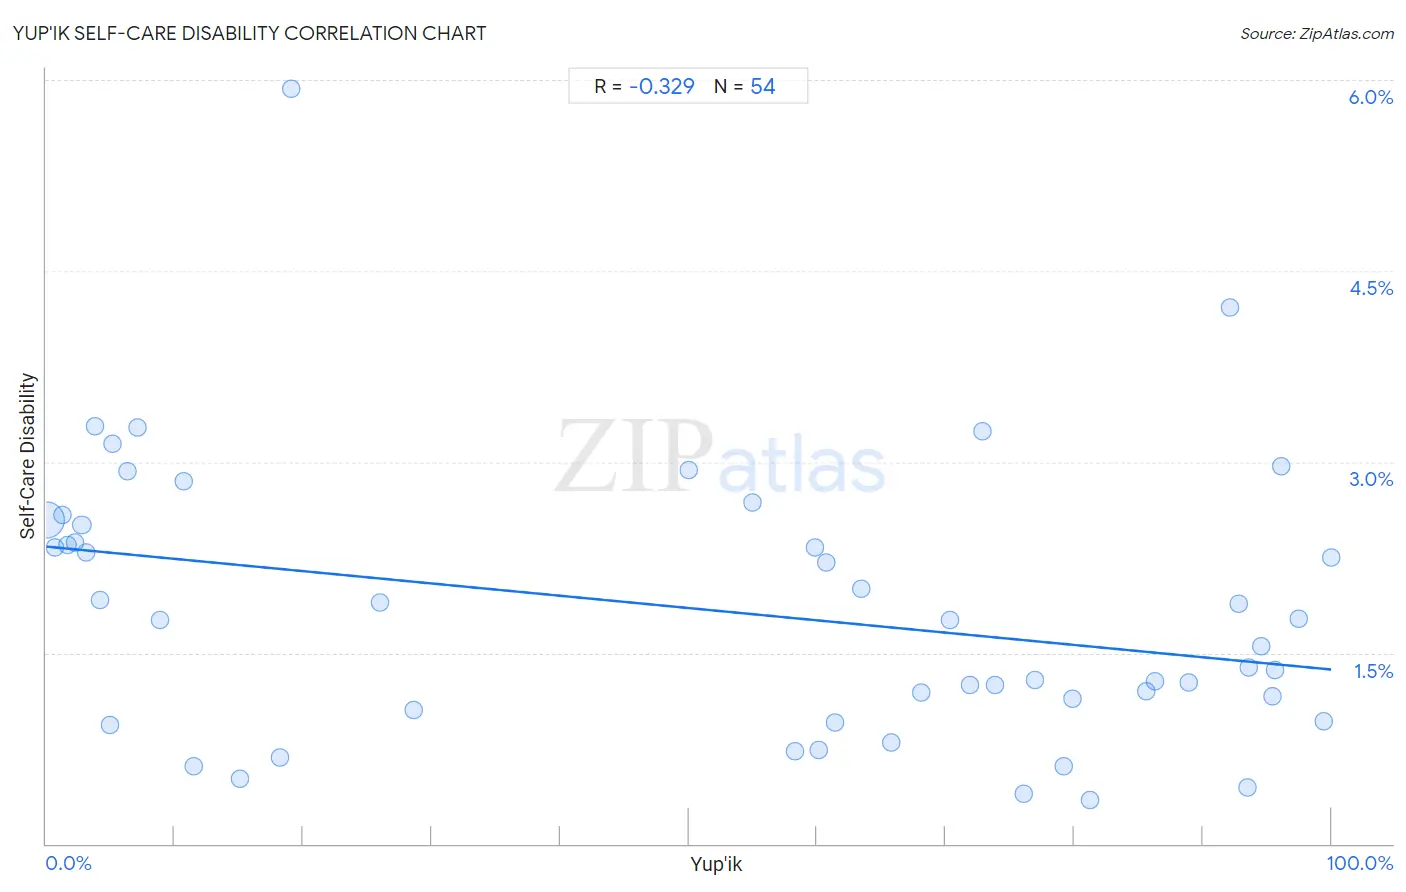
Yup'ik Self-Care Disability Correlation Chart
The statistical analysis conducted on geographies consisting of 39,934,897 people shows a mild negative correlation between the proportion of Yup'ik and percentage of population with self-care disability in the United States with a correlation coefficient (R) of -0.329 and weighted average of 1.9%. On average, for every 1% (one percent) increase in Yup'ik within a typical geography, there is a decrease of 0.0097% in percentage of population with self-care disability.
It is essential to understand that the correlation between the percentage of Yup'ik and percentage of population with self-care disability does not imply a direct cause-and-effect relationship. It remains uncertain whether the presence of Yup'ik influences an upward or downward trend in the level of percentage of population with self-care disability within an area, or if Yup'ik simply ended up residing in those areas with higher or lower levels of percentage of population with self-care disability due to other factors.
Demographics Similar to Yup'ik by Self-Care Disability
In terms of self-care disability, the demographic groups most similar to Yup'ik are Immigrants from India (2.0%, a difference of 8.2%), Thai (2.1%, a difference of 11.5%), Immigrants from Singapore (2.1%, a difference of 14.0%), Zimbabwean (2.2%, a difference of 15.1%), and Filipino (2.2%, a difference of 15.4%).
| Demographics | Rating | Rank | Self-Care Disability |
| Yup'ik | 100.0 /100 | #1 | Exceptional 1.9% |
| Immigrants from India | 100.0 /100 | #2 | Exceptional 2.0% |
| Thais | 100.0 /100 | #3 | Exceptional 2.1% |
| Immigrants from Singapore | 100.0 /100 | #4 | Exceptional 2.1% |
| Zimbabweans | 100.0 /100 | #5 | Exceptional 2.2% |
| Filipinos | 100.0 /100 | #6 | Exceptional 2.2% |
| Immigrants from Bolivia | 100.0 /100 | #7 | Exceptional 2.2% |
| Bolivians | 100.0 /100 | #8 | Exceptional 2.2% |
| Immigrants from Nepal | 100.0 /100 | #9 | Exceptional 2.2% |
| Sudanese | 100.0 /100 | #10 | Exceptional 2.2% |
| Immigrants from South Central Asia | 100.0 /100 | #11 | Exceptional 2.2% |
| Immigrants from Ethiopia | 100.0 /100 | #12 | Exceptional 2.2% |
| Ethiopians | 100.0 /100 | #13 | Exceptional 2.2% |
| Luxembourgers | 100.0 /100 | #14 | Exceptional 2.2% |
| Okinawans | 100.0 /100 | #15 | Exceptional 2.2% |
Yup'ik Self-Care Disability Correlation Summary
| Measurement | Yup'ik Data | Self-Care Disability Data |
| Minimum | 0.022% | 0.35% |
| Maximum | 100.0% | 5.9% |
| Range | 100.0% | 5.6% |
| Mean | 51.4% | 1.8% |
| Median | 61.0% | 1.8% |
| Interquartile 25% (IQ1) | 8.9% | 1.1% |
| Interquartile 75% (IQ3) | 85.6% | 2.5% |
| Interquartile Range (IQR) | 76.7% | 1.5% |
| Standard Deviation (Sample) | 36.7% | 1.1% |
| Standard Deviation (Population) | 36.4% | 1.1% |
Correlation Details
| Yup'ik Percentile | Sample Size | Self-Care Disability |
[ 0.0% - 0.5% ] 0.022% | 38,682,686 | 2.5% |
[ 0.5% - 1.0% ] 0.66% | 262,806 | 2.3% |
[ 1.0% - 1.5% ] 1.22% | 183,482 | 2.6% |
[ 1.5% - 2.0% ] 1.66% | 92,710 | 2.3% |
[ 2.0% - 2.5% ] 2.28% | 89,941 | 2.4% |
[ 2.5% - 3.0% ] 2.77% | 56,395 | 2.5% |
[ 3.0% - 3.5% ] 3.10% | 320,167 | 2.3% |
[ 3.5% - 4.0% ] 3.76% | 24,230 | 3.3% |
[ 4.0% - 4.5% ] 4.16% | 26,496 | 1.9% |
[ 4.5% - 5.0% ] 4.95% | 31,565 | 0.93% |
[ 5.0% - 5.5% ] 5.12% | 59,649 | 3.1% |
[ 6.0% - 6.5% ] 6.33% | 38,572 | 2.9% |
[ 7.0% - 7.5% ] 7.13% | 1,262 | 3.3% |
[ 8.5% - 9.0% ] 8.88% | 439 | 1.8% |
[ 10.5% - 11.0% ] 10.71% | 2,027 | 2.8% |
[ 11.0% - 11.5% ] 11.49% | 383 | 0.61% |
[ 15.0% - 15.5% ] 15.07% | 836 | 0.51% |
[ 18.0% - 18.5% ] 18.20% | 912 | 0.68% |
[ 19.0% - 19.5% ] 19.11% | 450 | 5.9% |
[ 25.5% - 26.0% ] 25.96% | 235 | 1.9% |
[ 28.5% - 29.0% ] 28.57% | 630 | 1.1% |
[ 50.0% - 50.5% ] 50.00% | 864 | 2.9% |
[ 54.5% - 55.0% ] 54.98% | 1,768 | 2.7% |
[ 58.0% - 58.5% ] 58.30% | 1,602 | 0.72% |
[ 59.5% - 60.0% ] 59.78% | 92 | 2.3% |
[ 60.0% - 60.5% ] 60.14% | 715 | 0.74% |
[ 60.5% - 61.0% ] 60.74% | 2,175 | 2.2% |
[ 61.0% - 61.5% ] 61.34% | 551 | 0.95% |
[ 63.0% - 63.5% ] 63.45% | 2,577 | 2.0% |
[ 65.5% - 66.0% ] 65.78% | 900 | 0.79% |
[ 68.0% - 68.5% ] 68.12% | 6,312 | 1.2% |
[ 70.0% - 70.5% ] 70.36% | 830 | 1.8% |
[ 71.5% - 72.0% ] 71.84% | 8,157 | 1.2% |
[ 72.5% - 73.0% ] 72.89% | 760 | 3.2% |
[ 73.5% - 74.0% ] 73.80% | 1,206 | 1.3% |
[ 76.0% - 76.5% ] 76.04% | 1,828 | 0.39% |
[ 76.5% - 77.0% ] 76.99% | 843 | 1.3% |
[ 79.0% - 79.5% ] 79.14% | 1,122 | 0.61% |
[ 79.5% - 80.0% ] 79.87% | 2,544 | 1.1% |
[ 81.0% - 81.5% ] 81.19% | 1,308 | 0.35% |
[ 85.5% - 86.0% ] 85.63% | 5,358 | 1.2% |
[ 86.0% - 86.5% ] 86.29% | 992 | 1.3% |
[ 88.5% - 89.0% ] 88.91% | 3,389 | 1.3% |
[ 92.0% - 92.5% ] 92.11% | 190 | 4.2% |
[ 92.5% - 93.0% ] 92.76% | 4,558 | 1.9% |
[ 93.0% - 93.5% ] 93.49% | 522 | 0.44% |
[ 93.5% - 94.0% ] 93.59% | 234 | 1.4% |
[ 94.5% - 95.0% ] 94.53% | 950 | 1.6% |
[ 95.0% - 95.5% ] 95.40% | 3,128 | 1.2% |
[ 95.5% - 96.0% ] 95.59% | 1,178 | 1.4% |
[ 96.0% - 96.5% ] 96.15% | 1,144 | 3.0% |
[ 97.0% - 97.5% ] 97.43% | 778 | 1.8% |
[ 99.0% - 99.5% ] 99.43% | 353 | 0.96% |
[ 99.5% - 100.0% ] 100.00% | 96 | 2.2% |