Immigrants from Morocco Self-Care Disability

COMPARE

Immigrants from Morocco
Race
Ancestry
AfghanAfricanAlaska NativeAlaskan AthabascanAlbanianAleutAlsatianAmericanApacheArabArapahoArgentineanArmenianAssyrian/Chaldean/SyriacAustralianAustrianBahamianBangladeshiBarbadianBasqueBelgianBelizeanBermudanBhutaneseBlackfeetBolivianBrazilianBritishBritish West IndianBulgarianBurmeseCajunCambodianCanadianCape VerdeanCarpatho RusynCelticCentral AmericanCentral American IndianCherokeeCheyenneChickasawChileanChineseChippewaChoctawColombianColvilleComancheCosta RicanCreeCreekCroatianCrowCubanCypriotCzechCzechoslovakianDanishDelawareDominicanDutchDutch West IndianEastern EuropeanEcuadorianEgyptianEnglishEstonianEthiopianEuropeanFijianFilipinoFinnishFrenchFrench American IndianFrench CanadianGermanGerman RussianGhanaianGreekGuamanian/ChamorroGuatemalanGuyaneseHaitianHmongHonduranHopiHoumaHungarianIcelanderIndian (Asian)IndonesianInupiatIranianIraqiIrishIroquoisIsraeliItalianJamaicanJapaneseJordanianKenyanKiowaKoreanLaotianLatvianLebaneseLiberianLithuanianLumbeeLuxembourgerMacedonianMalaysianMalteseMarshalleseMenomineeMexicanMexican American IndianMongolianMoroccanNative HawaiianNavajoNepaleseNew ZealanderNicaraguanNigerianNorthern EuropeanNorwegianOkinawanOsageOttawaPaiutePakistaniPalestinianPanamanianParaguayanPennsylvania GermanPeruvianPimaPolishPortuguesePotawatomiPuebloPuerto RicanPuget Sound SalishRomanianRussianSalvadoranSamoanScandinavianScotch-IrishScottishSeminoleSenegaleseSerbianShoshoneSierra LeoneanSiouxSlavicSlovakSloveneSomaliSouth AfricanSouth AmericanSouth American IndianSoviet UnionSpaniardSpanishSpanish AmericanSpanish American IndianSri LankanSubsaharan AfricanSudaneseSwedishSwissSyrianTaiwaneseThaiTlingit-HaidaTohono O'OdhamTonganTrinidadian and TobagonianTsimshianTurkishU.S. Virgin IslanderUgandanUkrainianUruguayanUteVenezuelanVietnameseWelshWest IndianYakamaYaquiYugoslavianYumanYup'ikZimbabwean
Immigration
NonimmigrantsImmigrantsAfghanistanAfricaAlbaniaArgentinaArmeniaAsiaAustraliaAustriaBahamasBangladeshBarbadosBelarusBelgiumBelizeBoliviaBosnia and HerzegovinaBrazilBulgariaBurma/MyanmarCabo VerdeCambodiaCameroonCanadaCaribbeanCentral AmericaChileChinaColombiaCongoCosta RicaCroatiaCubaCzechoslovakiaDenmarkDominicaDominican RepublicEastern AfricaEastern AsiaEastern EuropeEcuadorEgyptEl SalvadorEnglandEritreaEthiopiaEuropeFijiFranceGermanyGhanaGreeceGrenadaGuatemalaGuyanaHaitiHondurasHong KongHungaryIndiaIndonesiaIranIraqIrelandIsraelItalyJamaicaJapanJordanKazakhstanKenyaKoreaKuwaitLaosLatin AmericaLatviaLebanonLiberiaLithuaniaMalaysiaMexicoMicronesiaMiddle AfricaMoldovaMoroccoNepalNetherlandsNicaraguaNigeriaNorth AmericaNorth MacedoniaNorthern AfricaNorthern EuropeNorwayOceaniaPakistanPanamaPeruPhilippinesPolandPortugalRomaniaRussiaSaudi ArabiaScotlandSenegalSerbiaSierra LeoneSingaporeSomaliaSouth AfricaSouth AmericaSouth Central AsiaSouth Eastern AsiaSouthern EuropeSpainSri LankaSt. Vincent and the GrenadinesSudanSwedenSwitzerlandSyriaTaiwanThailandTrinidad and TobagoTurkeyUgandaUkraineUruguayUzbekistanVenezuelaVietnamWest IndiesWestern AfricaWestern AsiaWestern EuropeYemenZaireZimbabweAzores
Select to Compare
Race
Ancestry
AfghanAfricanAlaska NativeAlaskan AthabascanAlbanianAleutAlsatianAmericanApacheArabArapahoArgentineanArmenianAssyrian/Chaldean/SyriacAustralianAustrianBahamianBangladeshiBarbadianBasqueBelgianBelizeanBermudanBhutaneseBlackfeetBolivianBrazilianBritishBritish West IndianBulgarianBurmeseCajunCambodianCanadianCape VerdeanCarpatho RusynCelticCentral AmericanCentral American IndianCherokeeCheyenneChickasawChileanChineseChippewaChoctawColombianColvilleComancheCosta RicanCreeCreekCroatianCrowCubanCypriotCzechCzechoslovakianDanishDelawareDominicanDutchDutch West IndianEastern EuropeanEcuadorianEgyptianEnglishEstonianEthiopianEuropeanFijianFilipinoFinnishFrenchFrench American IndianFrench CanadianGermanGerman RussianGhanaianGreekGuamanian/ChamorroGuatemalanGuyaneseHaitianHmongHonduranHopiHoumaHungarianIcelanderIndian (Asian)IndonesianInupiatIranianIraqiIrishIroquoisIsraeliItalianJamaicanJapaneseJordanianKenyanKiowaKoreanLaotianLatvianLebaneseLiberianLithuanianLumbeeLuxembourgerMacedonianMalaysianMalteseMarshalleseMenomineeMexicanMexican American IndianMongolianMoroccanNative HawaiianNavajoNepaleseNew ZealanderNicaraguanNigerianNorthern EuropeanNorwegianOkinawanOsageOttawaPaiutePakistaniPalestinianPanamanianParaguayanPennsylvania GermanPeruvianPimaPolishPortuguesePotawatomiPuebloPuerto RicanPuget Sound SalishRomanianRussianSalvadoranSamoanScandinavianScotch-IrishScottishSeminoleSenegaleseSerbianShoshoneSierra LeoneanSiouxSlavicSlovakSloveneSomaliSouth AfricanSouth AmericanSouth American IndianSoviet UnionSpaniardSpanishSpanish AmericanSpanish American IndianSri LankanSubsaharan AfricanSudaneseSwedishSwissSyrianTaiwaneseThaiTlingit-HaidaTohono O'OdhamTonganTrinidadian and TobagonianTsimshianTurkishU.S. Virgin IslanderUgandanUkrainianUruguayanUteVenezuelanVietnameseWelshWest IndianYakamaYaquiYugoslavianYumanYup'ikZimbabwean
Immigration
NonimmigrantsImmigrantsAfghanistanAfricaAlbaniaArgentinaArmeniaAsiaAustraliaAustriaBahamasBangladeshBarbadosBelarusBelgiumBelizeBoliviaBosnia and HerzegovinaBrazilBulgariaBurma/MyanmarCabo VerdeCambodiaCameroonCanadaCaribbeanCentral AmericaChileChinaColombiaCongoCosta RicaCroatiaCubaCzechoslovakiaDenmarkDominicaDominican RepublicEastern AfricaEastern AsiaEastern EuropeEcuadorEgyptEl SalvadorEnglandEritreaEthiopiaEuropeFijiFranceGermanyGhanaGreeceGrenadaGuatemalaGuyanaHaitiHondurasHong KongHungaryIndiaIndonesiaIranIraqIrelandIsraelItalyJamaicaJapanJordanKazakhstanKenyaKoreaKuwaitLaosLatin AmericaLatviaLebanonLiberiaLithuaniaMalaysiaMexicoMicronesiaMiddle AfricaMoldovaNepalNetherlandsNicaraguaNigeriaNorth AmericaNorth MacedoniaNorthern AfricaNorthern EuropeNorwayOceaniaPakistanPanamaPeruPhilippinesPolandPortugalRomaniaRussiaSaudi ArabiaScotlandSenegalSerbiaSierra LeoneSingaporeSomaliaSouth AfricaSouth AmericaSouth Central AsiaSouth Eastern AsiaSouthern EuropeSpainSri LankaSt. Vincent and the GrenadinesSudanSwedenSwitzerlandSyriaTaiwanThailandTrinidad and TobagoTurkeyUgandaUkraineUruguayUzbekistanVenezuelaVietnamWest IndiesWestern AfricaWestern AsiaWestern EuropeYemenZaireZimbabweAzores
Self-Care Disability
Income
Poverty
Unemployment
Labor Participation
Family Structure
Vehicle Availability
Education Level
Disability

Immigrants from Morocco Self-Care Disability
Exceptional

2.4%
SELF-CARE DISABILITY
90.2/ 100
METRIC RATING
124th/ 347
METRIC RANK

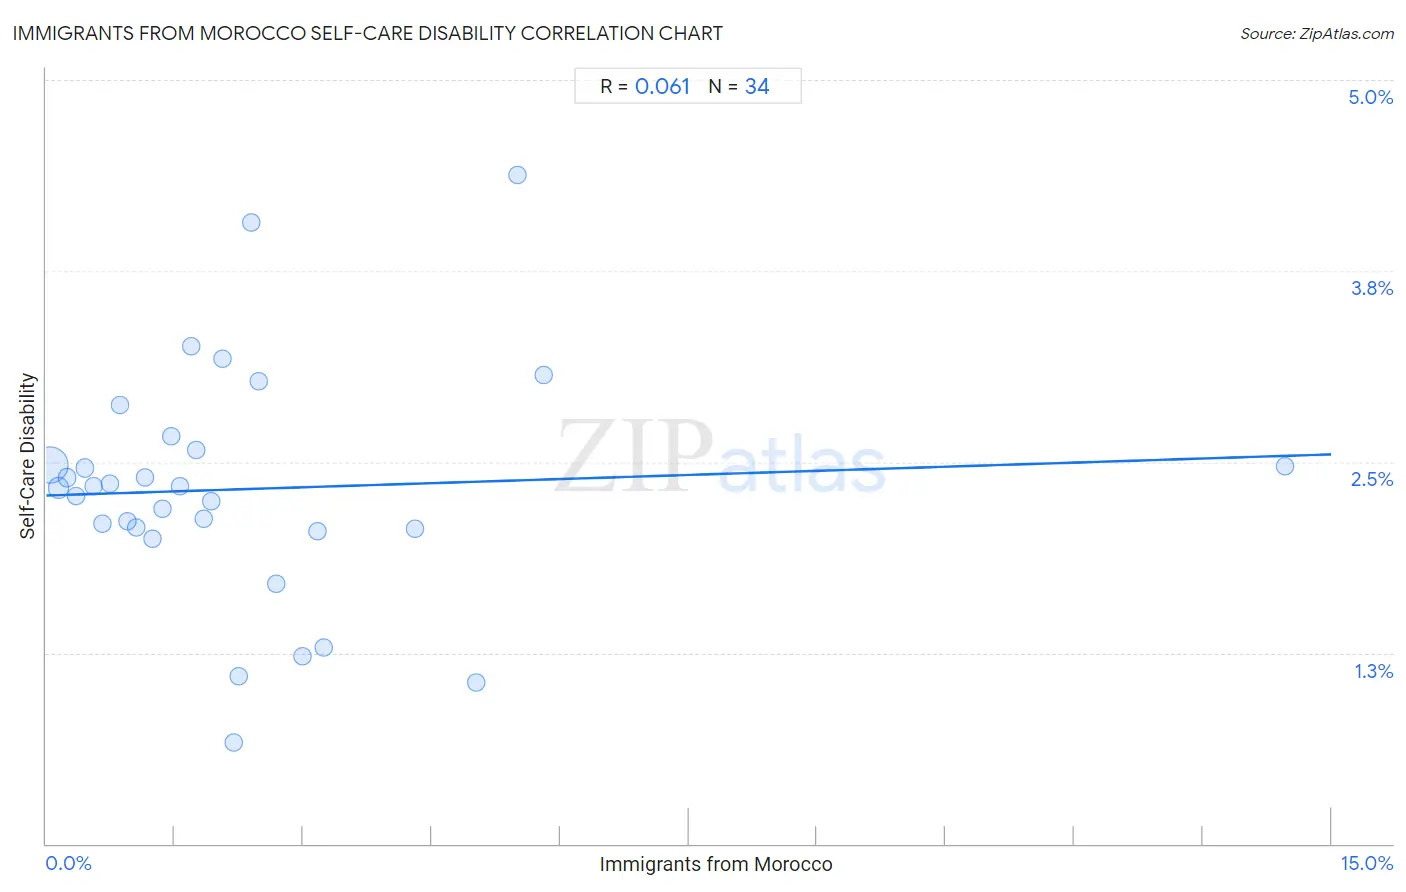
Immigrants from Morocco Self-Care Disability Correlation Chart

The statistical analysis conducted on geographies consisting of 178,885,702 people shows a slight positive correlation between the proportion of Immigrants from Morocco and percentage of population with self-care disability in the United States with a correlation coefficient (R) of 0.061 and weighted average of 2.4%. On average, for every 1% (one percent) increase in Immigrants from Morocco within a typical geography, there is an increase of 0.018% in percentage of population with self-care disability.
Immigrants from Morocco Self-Care Disability
It is essential to understand that the correlation between the percentage of Immigrants from Morocco and percentage of population with self-care disability does not imply a direct cause-and-effect relationship. It remains uncertain whether the presence of Immigrants from Morocco influences an upward or downward trend in the level of percentage of population with self-care disability within an area, or if Immigrants from Morocco simply ended up residing in those areas with higher or lower levels of percentage of population with self-care disability due to other factors.

Demographics Similar to Immigrants from Morocco by Self-Care Disability

In terms of self-care disability, the demographic groups most similar to Immigrants from Morocco are Immigrants from North America (2.4%, a difference of 0.0%), Immigrants from Nigeria (2.4%, a difference of 0.010%), Hmong (2.4%, a difference of 0.040%), Colombian (2.4%, a difference of 0.070%), and Immigrants from Hungary (2.4%, a difference of 0.080%).
DemographicsRating | RankSelf-Care Disability
Taiwanese
92.5
/100
|
#117
Exceptional
2.4%
Immigrants from Canada
92.0
/100
|
#118
Exceptional
2.4%
Immigrants from Sierra Leone
91.8
/100
|
#119
Exceptional
2.4%
Uruguayans
91.5
/100
|
#120
Exceptional
2.4%
Peruvians
91.3
/100
|
#121
Exceptional
2.4%
Belgians
90.9
/100
|
#122
Exceptional
2.4%
Immigrants from Nigeria
90.3
/100
|
#123
Exceptional
2.4%
Immigrants from North America
90.2
/100
|
#124
Exceptional
2.4%
Immigrants from Morocco
90.2
/100
|
#124
Exceptional
2.4%
Hmong
89.9
/100
|
#126
Excellent
2.4%
Colombians
89.7
/100
|
#127
Excellent
2.4%
Immigrants from Hungary
89.6
/100
|
#128
Excellent
2.4%
Immigrants from Romania
89.3
/100
|
#129
Excellent
2.4%
Immigrants from Austria
89.0
/100
|
#130
Excellent
2.4%
Poles
88.9
/100
|
#131
Excellent
2.4%

Immigrants from Morocco Self-Care Disability Correlation Summary

MeasurementImmigrants from Morocco DataSelf-Care Disability Data
Minimum0.040%0.66%
Maximum14.5%4.4%
Range14.4%3.7%
Mean2.3%2.3%
Median1.7%2.3%
Interquartile 25% (IQ1)0.86%2.1%
Interquartile 75% (IQ3)2.7%2.6%
Interquartile Range (IQR)1.8%0.52%
Standard Deviation (Sample)2.6%0.77%
Standard Deviation (Population)2.6%0.76%

Correlation Details

Immigrants from Morocco PercentileSample SizeSelf-Care Disability
[
0.0%
-
0.5%
]
0.040%
140,159,5692.5%
[
0.0%
-
0.5%
]
0.14%
21,988,0002.3%
[
0.0%
-
0.5%
]
0.24%
6,978,3862.4%
[
0.0%
-
0.5%
]
0.35%
2,805,1992.3%
[
0.0%
-
0.5%
]
0.45%
1,868,0462.5%
[
0.5%
-
1.0%
]
0.55%
1,759,0542.3%
[
0.5%
-
1.0%
]
0.66%
779,6692.1%
[
0.5%
-
1.0%
]
0.75%
865,8912.4%
[
0.5%
-
1.0%
]
0.86%
378,6002.9%
[
0.5%
-
1.0%
]
0.95%
294,1742.1%
[
1.0%
-
1.5%
]
1.05%
254,1592.1%
[
1.0%
-
1.5%
]
1.15%
131,3852.4%
[
1.0%
-
1.5%
]
1.25%
92,2412.0%
[
1.0%
-
1.5%
]
1.36%
84,2922.2%
[
1.0%
-
1.5%
]
1.47%
74,0492.7%
[
1.5%
-
2.0%
]
1.55%
55,3122.3%
[
1.5%
-
2.0%
]
1.69%
183,4973.3%
[
1.5%
-
2.0%
]
1.74%
11,6372.6%
[
1.5%
-
2.0%
]
1.84%
3,5912.1%
[
1.5%
-
2.0%
]
1.93%
33,0162.2%
[
2.0%
-
2.5%
]
2.06%
9,6833.2%
[
2.0%
-
2.5%
]
2.19%
3200.66%
[
2.0%
-
2.5%
]
2.25%
9791.1%
[
2.0%
-
2.5%
]
2.39%
14,6194.1%
[
2.0%
-
2.5%
]
2.48%
4,3503.0%
[
2.5%
-
3.0%
]
2.69%
20,1551.7%
[
2.5%
-
3.0%
]
2.98%
19,5311.2%
[
3.0%
-
3.5%
]
3.16%
1,8042.0%
[
3.0%
-
3.5%
]
3.24%
5,1211.3%
[
4.0%
-
4.5%
]
4.30%
4652.1%
[
5.0%
-
5.5%
]
5.02%
5,1201.1%
[
5.5%
-
6.0%
]
5.51%
8904.4%
[
5.5%
-
6.0%
]
5.81%
2,5663.1%
[
14.0%
-
14.5%
]
14.46%
3322.5%