Scotch-Irish Disability Age 18 to 34
COMPARE
Scotch-Irish
Select to Compare
Disability Age 18 to 34
Scotch-Irish Disability Age 18 to 34
7.8%
DISABILITY | AGE 18 TO 34
0.0/ 100
METRIC RATING
307th/ 347
METRIC RANK
Scotch-Irish Disability Age 18 to 34 Correlation Chart
The statistical analysis conducted on geographies consisting of 544,079,261 people shows a poor positive correlation between the proportion of Scotch-Irish and percentage of population with a disability between the ages 18 and 35 in the United States with a correlation coefficient (R) of 0.138 and weighted average of 7.8%. On average, for every 1% (one percent) increase in Scotch-Irish within a typical geography, there is an increase of 0.11% in percentage of population with a disability between the ages 18 and 35.
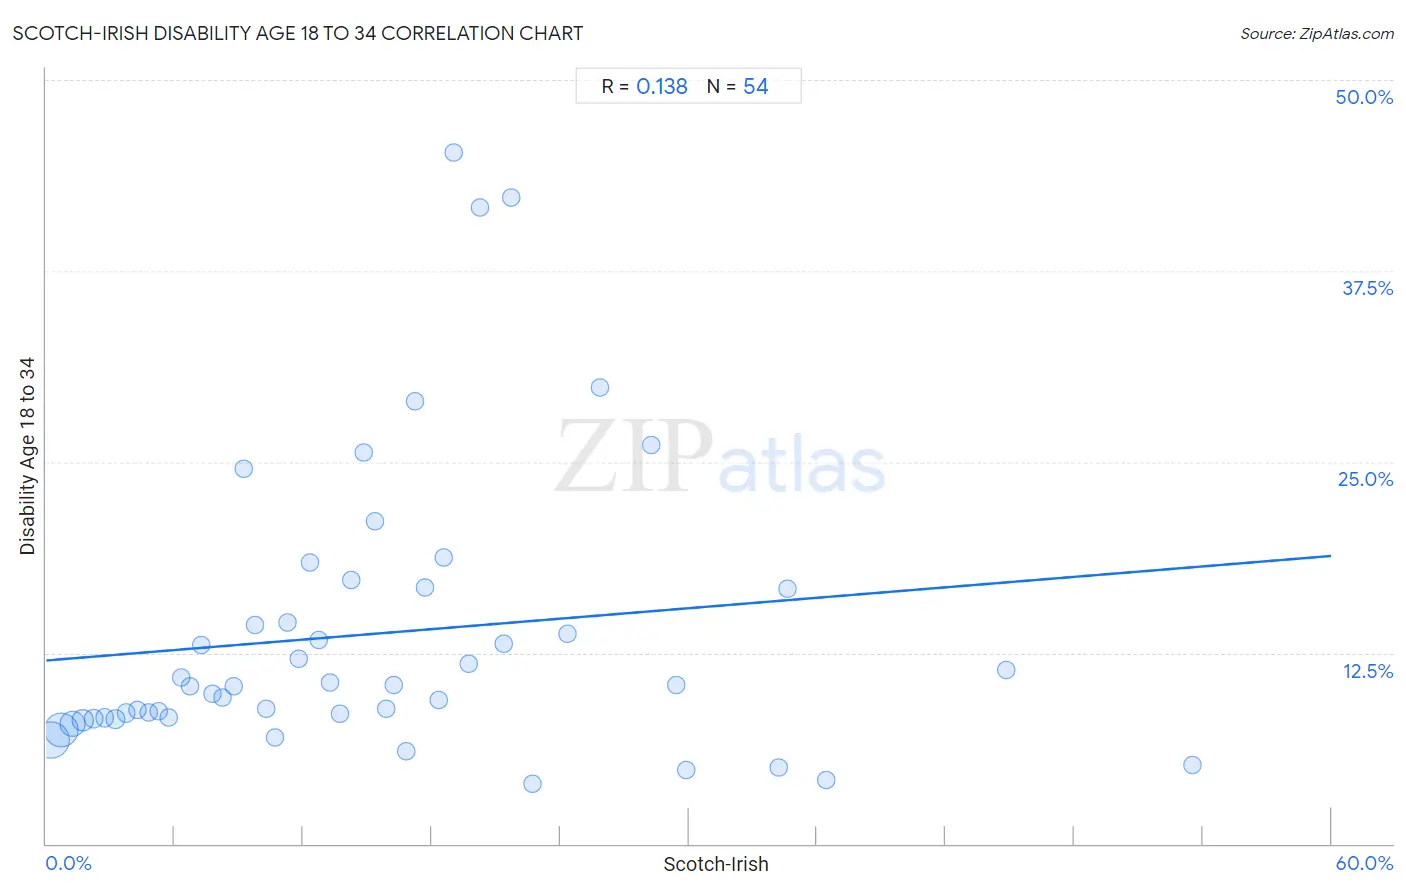
It is essential to understand that the correlation between the percentage of Scotch-Irish and percentage of population with a disability between the ages 18 and 35 does not imply a direct cause-and-effect relationship. It remains uncertain whether the presence of Scotch-Irish influences an upward or downward trend in the level of percentage of population with a disability between the ages 18 and 35 within an area, or if Scotch-Irish simply ended up residing in those areas with higher or lower levels of percentage of population with a disability between the ages 18 and 35 due to other factors.
Demographics Similar to Scotch-Irish by Disability Age 18 to 34
In terms of disability age 18 to 34, the demographic groups most similar to Scotch-Irish are Pennsylvania German (7.8%, a difference of 0.030%), Alaska Native (7.8%, a difference of 0.040%), Finnish (7.8%, a difference of 0.10%), English (7.8%, a difference of 0.26%), and Menominee (7.8%, a difference of 0.34%).
| Demographics | Rating | Rank | Disability Age 18 to 34 |
| Scottish | 0.0 /100 | #300 | Tragic 7.7% |
| Pima | 0.0 /100 | #301 | Tragic 7.7% |
| Welsh | 0.0 /100 | #302 | Tragic 7.7% |
| Cheyenne | 0.0 /100 | #303 | Tragic 7.7% |
| Shoshone | 0.0 /100 | #304 | Tragic 7.8% |
| Menominee | 0.0 /100 | #305 | Tragic 7.8% |
| English | 0.0 /100 | #306 | Tragic 7.8% |
| Scotch-Irish | 0.0 /100 | #307 | Tragic 7.8% |
| Pennsylvania Germans | 0.0 /100 | #308 | Tragic 7.8% |
| Alaska Natives | 0.0 /100 | #309 | Tragic 7.8% |
| Finns | 0.0 /100 | #310 | Tragic 7.8% |
| French | 0.0 /100 | #311 | Tragic 7.9% |
| Spanish Americans | 0.0 /100 | #312 | Tragic 7.9% |
| Iroquois | 0.0 /100 | #313 | Tragic 7.9% |
| Colville | 0.0 /100 | #314 | Tragic 7.9% |
Scotch-Irish Disability Age 18 to 34 Correlation Summary
| Measurement | Scotch-Irish Data | Disability Age 18 to 34 Data |
| Minimum | 0.25% | 3.9% |
| Maximum | 53.5% | 45.2% |
| Range | 53.3% | 41.3% |
| Mean | 15.3% | 13.7% |
| Median | 13.5% | 10.4% |
| Interquartile 25% (IQ1) | 6.7% | 8.2% |
| Interquartile 75% (IQ3) | 20.3% | 16.7% |
| Interquartile Range (IQR) | 13.6% | 8.4% |
| Standard Deviation (Sample) | 11.4% | 9.4% |
| Standard Deviation (Population) | 11.3% | 9.4% |
Correlation Details
| Scotch-Irish Percentile | Sample Size | Disability Age 18 to 34 |
[ 0.0% - 0.5% ] 0.25% | 209,733,247 | 6.8% |
[ 0.5% - 1.0% ] 0.72% | 182,197,484 | 7.5% |
[ 1.0% - 1.5% ] 1.21% | 82,001,020 | 7.9% |
[ 1.5% - 2.0% ] 1.71% | 36,034,158 | 8.1% |
[ 2.0% - 2.5% ] 2.21% | 15,609,659 | 8.2% |
[ 2.5% - 3.0% ] 2.73% | 7,647,390 | 8.2% |
[ 3.0% - 3.5% ] 3.23% | 4,941,754 | 8.2% |
[ 3.5% - 4.0% ] 3.75% | 2,342,294 | 8.6% |
[ 4.0% - 4.5% ] 4.25% | 1,198,547 | 8.7% |
[ 4.5% - 5.0% ] 4.76% | 675,554 | 8.6% |
[ 5.0% - 5.5% ] 5.23% | 595,326 | 8.7% |
[ 5.5% - 6.0% ] 5.71% | 290,239 | 8.3% |
[ 6.0% - 6.5% ] 6.29% | 175,128 | 10.9% |
[ 6.5% - 7.0% ] 6.71% | 115,445 | 10.3% |
[ 7.0% - 7.5% ] 7.22% | 95,401 | 13.0% |
[ 7.5% - 8.0% ] 7.79% | 97,740 | 9.9% |
[ 8.0% - 8.5% ] 8.21% | 51,058 | 9.6% |
[ 8.5% - 9.0% ] 8.75% | 52,521 | 10.3% |
[ 9.0% - 9.5% ] 9.24% | 29,064 | 24.6% |
[ 9.5% - 10.0% ] 9.74% | 28,155 | 14.3% |
[ 10.0% - 10.5% ] 10.28% | 33,795 | 8.9% |
[ 10.5% - 11.0% ] 10.69% | 17,385 | 6.9% |
[ 11.0% - 11.5% ] 11.27% | 13,681 | 14.5% |
[ 11.5% - 12.0% ] 11.76% | 11,212 | 12.1% |
[ 12.0% - 12.5% ] 12.30% | 3,731 | 18.4% |
[ 12.5% - 13.0% ] 12.75% | 3,561 | 13.3% |
[ 13.0% - 13.5% ] 13.23% | 16,515 | 10.6% |
[ 13.5% - 14.0% ] 13.71% | 15,983 | 8.5% |
[ 14.0% - 14.5% ] 14.24% | 14,081 | 17.2% |
[ 14.5% - 15.0% ] 14.81% | 797 | 25.6% |
[ 15.0% - 15.5% ] 15.34% | 1,715 | 21.1% |
[ 15.5% - 16.0% ] 15.87% | 3,434 | 8.9% |
[ 16.0% - 16.5% ] 16.21% | 7,990 | 10.4% |
[ 16.5% - 17.0% ] 16.81% | 3,695 | 6.1% |
[ 17.0% - 17.5% ] 17.25% | 2,534 | 29.0% |
[ 17.5% - 18.0% ] 17.66% | 7,617 | 16.8% |
[ 18.0% - 18.5% ] 18.32% | 1,867 | 9.4% |
[ 18.5% - 19.0% ] 18.55% | 275 | 18.8% |
[ 19.0% - 19.5% ] 19.03% | 925 | 45.2% |
[ 19.5% - 20.0% ] 19.71% | 974 | 11.8% |
[ 20.0% - 20.5% ] 20.28% | 217 | 41.7% |
[ 21.0% - 21.5% ] 21.34% | 731 | 13.1% |
[ 21.5% - 22.0% ] 21.71% | 456 | 42.3% |
[ 22.5% - 23.0% ] 22.68% | 732 | 3.9% |
[ 24.0% - 24.5% ] 24.34% | 226 | 13.8% |
[ 25.5% - 26.0% ] 25.83% | 724 | 29.9% |
[ 28.0% - 28.5% ] 28.26% | 92 | 26.1% |
[ 29.0% - 29.5% ] 29.42% | 469 | 10.4% |
[ 29.5% - 30.0% ] 29.91% | 662 | 4.9% |
[ 34.0% - 34.5% ] 34.22% | 450 | 5.0% |
[ 34.5% - 35.0% ] 34.59% | 185 | 16.7% |
[ 36.0% - 36.5% ] 36.40% | 728 | 4.2% |
[ 44.5% - 45.0% ] 44.84% | 339 | 11.4% |
[ 53.5% - 54.0% ] 53.51% | 299 | 5.2% |