Immigrants from Uruguay Self-Care Disability
COMPARE
Immigrants from Uruguay
Select to Compare
Self-Care Disability
Immigrants from Uruguay Self-Care Disability
2.4%
SELF-CARE DISABILITY
85.4/ 100
METRIC RATING
140th/ 347
METRIC RANK
Immigrants from Uruguay Self-Care Disability Correlation Chart
The statistical analysis conducted on geographies consisting of 133,239,464 people shows a mild negative correlation between the proportion of Immigrants from Uruguay and percentage of population with self-care disability in the United States with a correlation coefficient (R) of -0.321 and weighted average of 2.4%. On average, for every 1% (one percent) increase in Immigrants from Uruguay within a typical geography, there is a decrease of 0.12% in percentage of population with self-care disability.
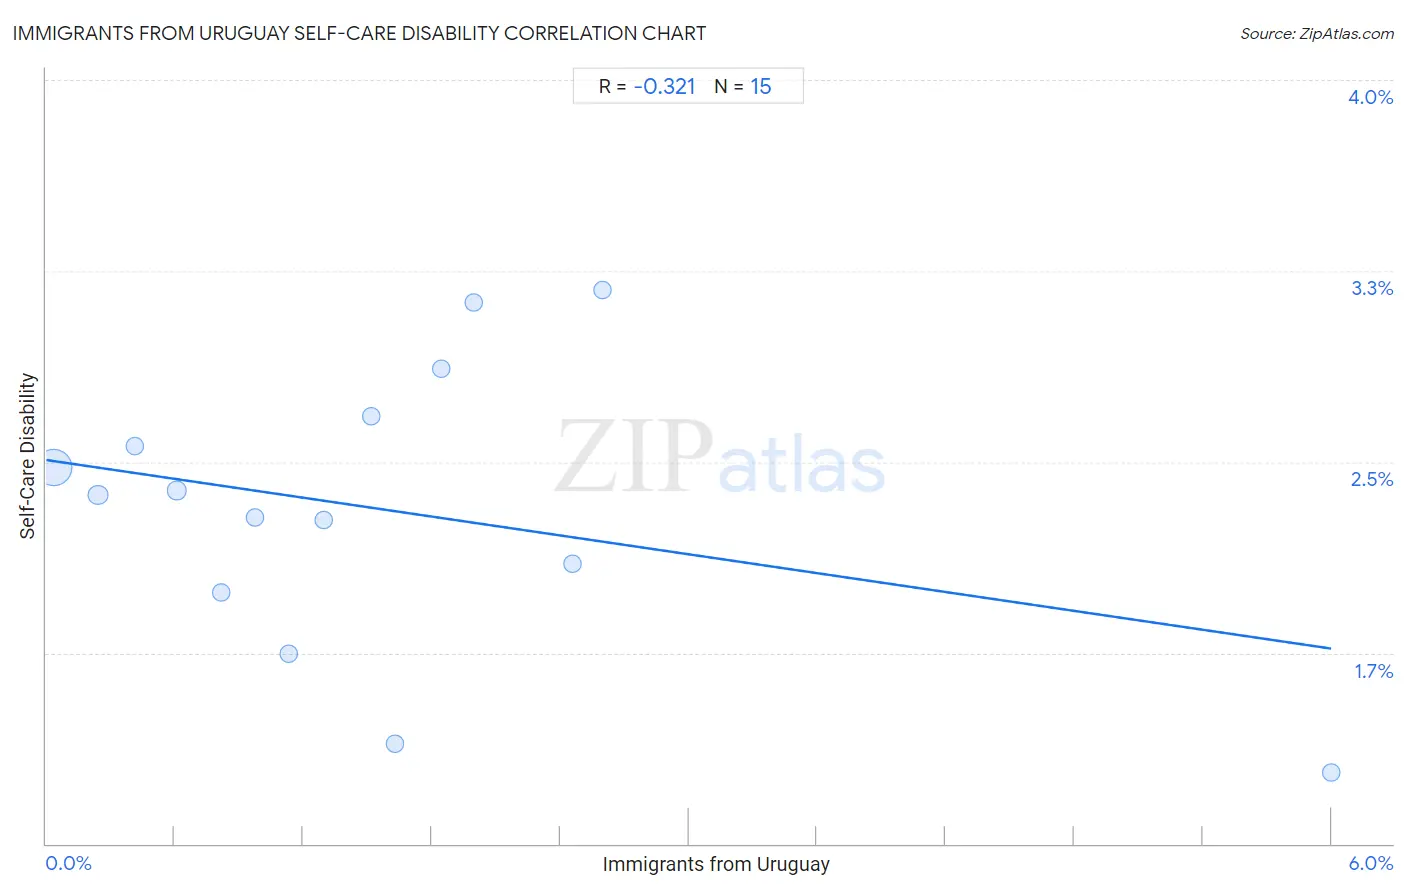
It is essential to understand that the correlation between the percentage of Immigrants from Uruguay and percentage of population with self-care disability does not imply a direct cause-and-effect relationship. It remains uncertain whether the presence of Immigrants from Uruguay influences an upward or downward trend in the level of percentage of population with self-care disability within an area, or if Immigrants from Uruguay simply ended up residing in those areas with higher or lower levels of percentage of population with self-care disability due to other factors.
Demographics Similar to Immigrants from Uruguay by Self-Care Disability
In terms of self-care disability, the demographic groups most similar to Immigrants from Uruguay are Alaska Native (2.4%, a difference of 0.090%), Immigrants from Croatia (2.4%, a difference of 0.12%), Sri Lankan (2.4%, a difference of 0.12%), Austrian (2.4%, a difference of 0.17%), and South American Indian (2.4%, a difference of 0.19%).
| Demographics | Rating | Rank | Self-Care Disability |
| Immigrants from Colombia | 88.5 /100 | #133 | Excellent 2.4% |
| Russians | 88.2 /100 | #134 | Excellent 2.4% |
| Laotians | 87.8 /100 | #135 | Excellent 2.4% |
| South American Indians | 87.2 /100 | #136 | Excellent 2.4% |
| Austrians | 87.0 /100 | #137 | Excellent 2.4% |
| Immigrants from Croatia | 86.6 /100 | #138 | Excellent 2.4% |
| Sri Lankans | 86.6 /100 | #139 | Excellent 2.4% |
| Immigrants from Uruguay | 85.4 /100 | #140 | Excellent 2.4% |
| Alaska Natives | 84.5 /100 | #141 | Excellent 2.4% |
| Immigrants from Peru | 83.2 /100 | #142 | Excellent 2.4% |
| Afghans | 82.3 /100 | #143 | Excellent 2.4% |
| Costa Ricans | 80.8 /100 | #144 | Excellent 2.4% |
| Germans | 80.1 /100 | #145 | Excellent 2.4% |
| Israelis | 80.0 /100 | #146 | Good 2.4% |
| Dutch | 77.5 /100 | #147 | Good 2.4% |
Immigrants from Uruguay Self-Care Disability Correlation Summary
| Measurement | Immigrants from Uruguay Data | Self-Care Disability Data |
| Minimum | 0.035% | 1.3% |
| Maximum | 6.0% | 3.2% |
| Range | 6.0% | 1.9% |
| Mean | 1.6% | 2.3% |
| Median | 1.3% | 2.4% |
| Interquartile 25% (IQ1) | 0.61% | 2.0% |
| Interquartile 75% (IQ3) | 2.0% | 2.7% |
| Interquartile Range (IQR) | 1.4% | 0.69% |
| Standard Deviation (Sample) | 1.4% | 0.56% |
| Standard Deviation (Population) | 1.4% | 0.54% |
Correlation Details
| Immigrants from Uruguay Percentile | Sample Size | Self-Care Disability |
[ 0.0% - 0.5% ] 0.035% | 119,954,098 | 2.5% |
[ 0.0% - 0.5% ] 0.24% | 8,938,267 | 2.4% |
[ 0.0% - 0.5% ] 0.41% | 2,019,842 | 2.6% |
[ 0.5% - 1.0% ] 0.61% | 1,020,006 | 2.4% |
[ 0.5% - 1.0% ] 0.81% | 589,270 | 2.0% |
[ 0.5% - 1.0% ] 0.98% | 194,499 | 2.3% |
[ 1.0% - 1.5% ] 1.13% | 206,258 | 1.7% |
[ 1.0% - 1.5% ] 1.30% | 124,606 | 2.3% |
[ 1.5% - 2.0% ] 1.52% | 28,137 | 2.7% |
[ 1.5% - 2.0% ] 1.63% | 3,868 | 1.4% |
[ 1.5% - 2.0% ] 1.84% | 145,531 | 2.9% |
[ 1.5% - 2.0% ] 2.00% | 9,119 | 3.1% |
[ 2.0% - 2.5% ] 2.46% | 3,864 | 2.1% |
[ 2.5% - 3.0% ] 2.60% | 1,849 | 3.2% |
[ 6.0% - 6.5% ] 6.00% | 250 | 1.3% |