Irish Self-Care Disability
COMPARE
Irish
Select to Compare
Self-Care Disability
Irish Self-Care Disability
2.5%
SELF-CARE DISABILITY
28.7/ 100
METRIC RATING
187th/ 347
METRIC RANK
Irish Self-Care Disability Correlation Chart
The statistical analysis conducted on geographies consisting of 577,353,633 people shows a substantial positive correlation between the proportion of Irish and percentage of population with self-care disability in the United States with a correlation coefficient (R) of 0.510 and weighted average of 2.5%. On average, for every 1% (one percent) increase in Irish within a typical geography, there is an increase of 0.16% in percentage of population with self-care disability.
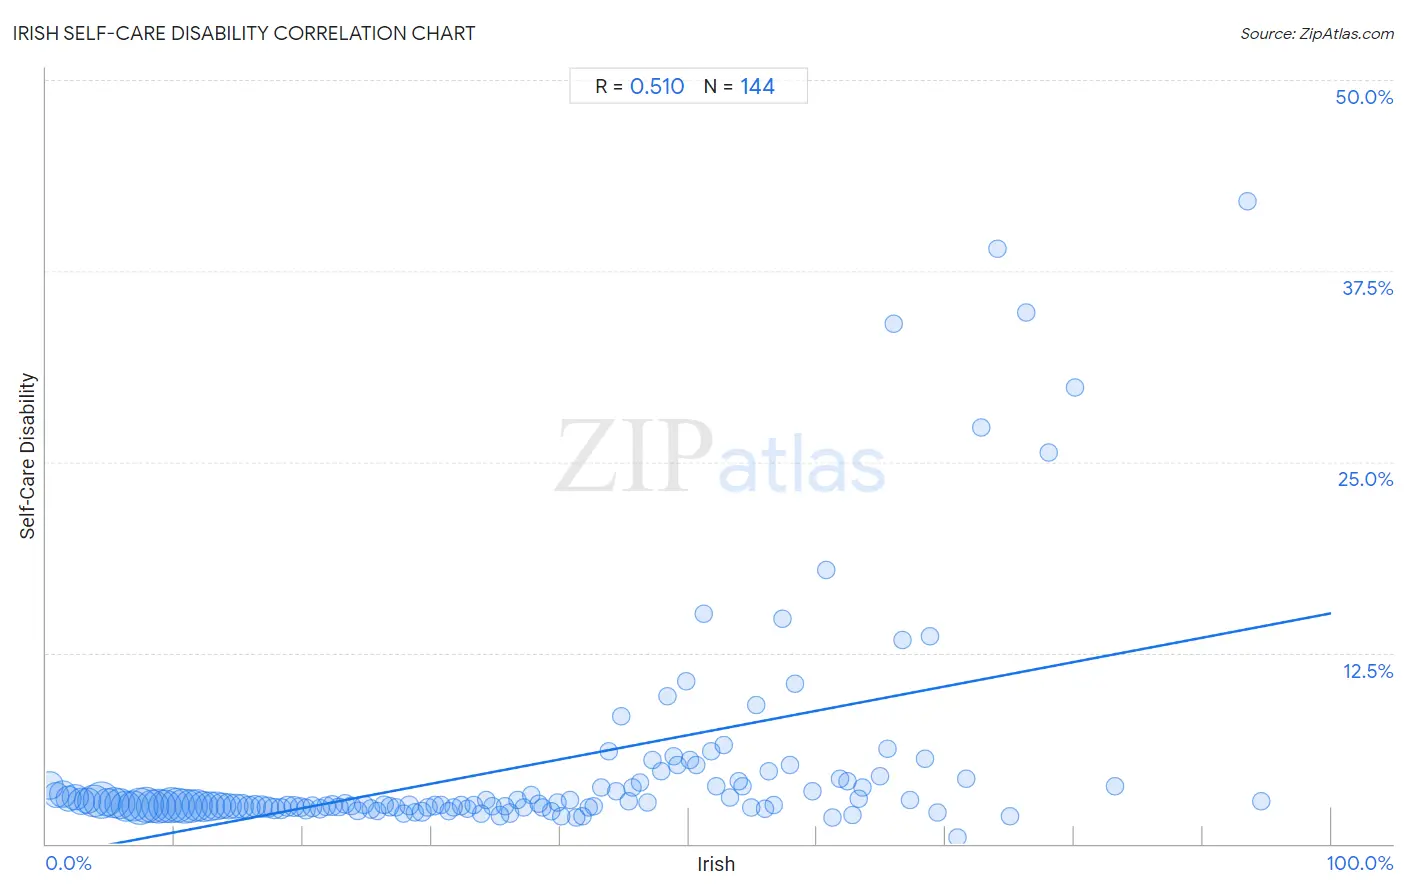
It is essential to understand that the correlation between the percentage of Irish and percentage of population with self-care disability does not imply a direct cause-and-effect relationship. It remains uncertain whether the presence of Irish influences an upward or downward trend in the level of percentage of population with self-care disability within an area, or if Irish simply ended up residing in those areas with higher or lower levels of percentage of population with self-care disability due to other factors.
Demographics Similar to Irish by Self-Care Disability
In terms of self-care disability, the demographic groups most similar to Irish are Immigrants from Oceania (2.5%, a difference of 0.030%), Immigrants from Eastern Europe (2.5%, a difference of 0.040%), Immigrants from El Salvador (2.5%, a difference of 0.23%), Sioux (2.5%, a difference of 0.25%), and Slavic (2.5%, a difference of 0.31%).
| Demographics | Rating | Rank | Self-Care Disability |
| Indonesians | 41.2 /100 | #180 | Average 2.5% |
| Ghanaians | 40.4 /100 | #181 | Average 2.5% |
| Maltese | 37.5 /100 | #182 | Fair 2.5% |
| Salvadorans | 36.4 /100 | #183 | Fair 2.5% |
| Yugoslavians | 36.1 /100 | #184 | Fair 2.5% |
| Slavs | 34.3 /100 | #185 | Fair 2.5% |
| Immigrants from El Salvador | 33.0 /100 | #186 | Fair 2.5% |
| Irish | 28.7 /100 | #187 | Fair 2.5% |
| Immigrants from Oceania | 28.3 /100 | #188 | Fair 2.5% |
| Immigrants from Eastern Europe | 28.0 /100 | #189 | Fair 2.5% |
| Sioux | 24.6 /100 | #190 | Fair 2.5% |
| Moroccans | 22.9 /100 | #191 | Fair 2.5% |
| Soviet Union | 22.2 /100 | #192 | Fair 2.5% |
| Ukrainians | 21.4 /100 | #193 | Fair 2.5% |
| Immigrants from Germany | 17.9 /100 | #194 | Poor 2.5% |
Irish Self-Care Disability Correlation Summary
| Measurement | Irish Data | Self-Care Disability Data |
| Minimum | 0.26% | 0.44% |
| Maximum | 94.5% | 42.0% |
| Range | 94.2% | 41.6% |
| Mean | 37.0% | 5.0% |
| Median | 35.9% | 2.6% |
| Interquartile 25% (IQ1) | 18.0% | 2.4% |
| Interquartile 75% (IQ3) | 54.0% | 3.9% |
| Interquartile Range (IQR) | 36.0% | 1.5% |
| Standard Deviation (Sample) | 22.6% | 7.0% |
| Standard Deviation (Population) | 22.5% | 7.0% |
Correlation Details
| Irish Percentile | Sample Size | Self-Care Disability |
[ 0.0% - 0.5% ] 0.26% | 12,525,755 | 3.8% |
[ 0.5% - 1.0% ] 0.73% | 10,407,669 | 3.2% |
[ 1.0% - 1.5% ] 1.26% | 11,218,599 | 3.3% |
[ 1.5% - 2.0% ] 1.76% | 10,637,784 | 3.0% |
[ 2.0% - 2.5% ] 2.26% | 11,098,337 | 3.0% |
[ 2.5% - 3.0% ] 2.74% | 11,967,216 | 2.8% |
[ 3.0% - 3.5% ] 3.25% | 11,889,707 | 2.8% |
[ 3.5% - 4.0% ] 3.71% | 19,860,814 | 2.8% |
[ 4.0% - 4.5% ] 4.30% | 25,375,786 | 2.9% |
[ 4.5% - 5.0% ] 4.74% | 14,311,936 | 2.7% |
[ 5.0% - 5.5% ] 5.24% | 16,796,759 | 2.7% |
[ 5.5% - 6.0% ] 5.74% | 17,391,276 | 2.6% |
[ 6.0% - 6.5% ] 6.25% | 17,445,527 | 2.5% |
[ 6.5% - 7.0% ] 6.76% | 17,925,473 | 2.5% |
[ 7.0% - 7.5% ] 7.25% | 25,763,192 | 2.5% |
[ 7.5% - 8.0% ] 7.75% | 24,458,887 | 2.5% |
[ 8.0% - 8.5% ] 8.26% | 20,541,798 | 2.5% |
[ 8.5% - 9.0% ] 8.73% | 22,616,017 | 2.5% |
[ 9.0% - 9.5% ] 9.25% | 20,520,167 | 2.5% |
[ 9.5% - 10.0% ] 9.75% | 23,670,292 | 2.6% |
[ 10.0% - 10.5% ] 10.24% | 21,883,513 | 2.5% |
[ 10.5% - 11.0% ] 10.74% | 22,623,773 | 2.5% |
[ 11.0% - 11.5% ] 11.26% | 21,103,699 | 2.5% |
[ 11.5% - 12.0% ] 11.76% | 17,936,325 | 2.5% |
[ 12.0% - 12.5% ] 12.23% | 16,379,798 | 2.4% |
[ 12.5% - 13.0% ] 12.76% | 15,195,499 | 2.5% |
[ 13.0% - 13.5% ] 13.24% | 14,761,428 | 2.5% |
[ 13.5% - 14.0% ] 13.74% | 11,654,975 | 2.5% |
[ 14.0% - 14.5% ] 14.24% | 10,166,013 | 2.5% |
[ 14.5% - 15.0% ] 14.74% | 8,810,421 | 2.5% |
[ 15.0% - 15.5% ] 15.24% | 8,195,402 | 2.5% |
[ 15.5% - 16.0% ] 15.75% | 6,677,813 | 2.4% |
[ 16.0% - 16.5% ] 16.25% | 5,485,953 | 2.4% |
[ 16.5% - 17.0% ] 16.74% | 4,373,889 | 2.4% |
[ 17.0% - 17.5% ] 17.25% | 4,400,978 | 2.4% |
[ 17.5% - 18.0% ] 17.74% | 3,982,812 | 2.3% |
[ 18.0% - 18.5% ] 18.25% | 3,674,239 | 2.3% |
[ 18.5% - 19.0% ] 18.74% | 3,365,541 | 2.5% |
[ 19.0% - 19.5% ] 19.27% | 3,005,176 | 2.5% |
[ 19.5% - 20.0% ] 19.76% | 2,832,021 | 2.4% |
[ 20.0% - 20.5% ] 20.22% | 2,658,775 | 2.3% |
[ 20.5% - 21.0% ] 20.74% | 2,003,482 | 2.4% |
[ 21.0% - 21.5% ] 21.26% | 1,833,907 | 2.3% |
[ 21.5% - 22.0% ] 21.74% | 1,692,259 | 2.5% |
[ 22.0% - 22.5% ] 22.27% | 2,017,716 | 2.5% |
[ 22.5% - 23.0% ] 22.75% | 1,446,765 | 2.4% |
[ 23.0% - 23.5% ] 23.27% | 1,377,389 | 2.6% |
[ 23.5% - 24.0% ] 23.76% | 1,045,813 | 2.5% |
[ 24.0% - 24.5% ] 24.26% | 1,154,734 | 2.1% |
[ 24.5% - 25.0% ] 24.73% | 860,276 | 2.6% |
[ 25.0% - 25.5% ] 25.24% | 1,018,975 | 2.3% |
[ 25.5% - 26.0% ] 25.76% | 748,501 | 2.1% |
[ 26.0% - 26.5% ] 26.30% | 690,332 | 2.6% |
[ 26.5% - 27.0% ] 26.76% | 482,357 | 2.4% |
[ 27.0% - 27.5% ] 27.22% | 485,846 | 2.4% |
[ 27.5% - 28.0% ] 27.80% | 482,074 | 2.0% |
[ 28.0% - 28.5% ] 28.24% | 570,062 | 2.5% |
[ 28.5% - 29.0% ] 28.72% | 472,579 | 2.0% |
[ 29.0% - 29.5% ] 29.21% | 343,829 | 2.1% |
[ 29.5% - 30.0% ] 29.70% | 455,351 | 2.4% |
[ 30.0% - 30.5% ] 30.24% | 278,254 | 2.5% |
[ 30.5% - 31.0% ] 30.72% | 267,164 | 2.5% |
[ 31.0% - 31.5% ] 31.33% | 236,894 | 2.1% |
[ 31.5% - 32.0% ] 31.74% | 342,075 | 2.4% |
[ 32.0% - 32.5% ] 32.27% | 179,849 | 2.5% |
[ 32.5% - 33.0% ] 32.80% | 120,105 | 2.3% |
[ 33.0% - 33.5% ] 33.25% | 89,348 | 2.6% |
[ 33.5% - 34.0% ] 33.81% | 140,459 | 1.9% |
[ 34.0% - 34.5% ] 34.24% | 72,285 | 2.9% |
[ 34.5% - 35.0% ] 34.76% | 142,024 | 2.4% |
[ 35.0% - 35.5% ] 35.29% | 101,729 | 1.8% |
[ 35.5% - 36.0% ] 35.70% | 36,781 | 2.5% |
[ 36.0% - 36.5% ] 36.12% | 80,550 | 2.0% |
[ 36.5% - 37.0% ] 36.69% | 35,141 | 2.8% |
[ 37.0% - 37.5% ] 37.15% | 43,951 | 2.4% |
[ 37.5% - 38.0% ] 37.77% | 29,402 | 3.2% |
[ 38.0% - 38.5% ] 38.28% | 39,837 | 2.6% |
[ 38.5% - 39.0% ] 38.62% | 31,830 | 2.4% |
[ 39.0% - 39.5% ] 39.30% | 73,900 | 2.1% |
[ 39.5% - 40.0% ] 39.77% | 39,428 | 2.7% |
[ 40.0% - 40.5% ] 40.10% | 28,955 | 1.8% |
[ 40.5% - 41.0% ] 40.75% | 8,435 | 2.8% |
[ 41.0% - 41.5% ] 41.26% | 18,154 | 1.7% |
[ 41.5% - 42.0% ] 41.74% | 31,410 | 1.8% |
[ 42.0% - 42.5% ] 42.20% | 3,078 | 2.4% |
[ 42.5% - 43.0% ] 42.65% | 8,690 | 2.5% |
[ 43.0% - 43.5% ] 43.22% | 9,046 | 3.7% |
[ 43.5% - 44.0% ] 43.75% | 1,655 | 6.0% |
[ 44.0% - 44.5% ] 44.37% | 4,631 | 3.4% |
[ 44.5% - 45.0% ] 44.73% | 6,228 | 8.3% |
[ 45.0% - 45.5% ] 45.31% | 12,184 | 2.8% |
[ 45.5% - 46.0% ] 45.61% | 1,914 | 3.7% |
[ 46.0% - 46.5% ] 46.24% | 2,829 | 4.0% |
[ 46.5% - 47.0% ] 46.78% | 838 | 2.7% |
[ 47.0% - 47.5% ] 47.17% | 12,242 | 5.5% |
[ 47.5% - 48.0% ] 47.86% | 6,531 | 4.8% |
[ 48.0% - 48.5% ] 48.35% | 1,727 | 9.6% |
[ 48.5% - 49.0% ] 48.85% | 739 | 5.7% |
[ 49.0% - 49.5% ] 49.11% | 951 | 5.1% |
[ 49.5% - 50.0% ] 49.84% | 2,157 | 10.7% |
[ 50.0% - 50.5% ] 50.11% | 1,854 | 5.5% |
[ 50.5% - 51.0% ] 50.61% | 2,120 | 5.2% |
[ 51.0% - 51.5% ] 51.16% | 1,337 | 15.0% |
[ 51.5% - 52.0% ] 51.78% | 1,605 | 6.1% |
[ 52.0% - 52.5% ] 52.15% | 792 | 3.8% |
[ 52.5% - 53.0% ] 52.76% | 2,540 | 6.5% |
[ 53.0% - 53.5% ] 53.26% | 3,361 | 3.0% |
[ 53.5% - 54.0% ] 53.87% | 4,615 | 4.1% |
[ 54.0% - 54.5% ] 54.19% | 1,264 | 3.7% |
[ 54.5% - 55.0% ] 54.86% | 1,039 | 2.4% |
[ 55.0% - 55.5% ] 55.23% | 1,932 | 9.1% |
[ 55.5% - 56.0% ] 55.94% | 379 | 2.3% |
[ 56.0% - 56.5% ] 56.21% | 1,482 | 4.7% |
[ 56.5% - 57.0% ] 56.60% | 371 | 2.6% |
[ 57.0% - 57.5% ] 57.26% | 124 | 14.7% |
[ 57.5% - 58.0% ] 57.86% | 1,018 | 5.1% |
[ 58.0% - 58.5% ] 58.24% | 704 | 10.5% |
[ 59.5% - 60.0% ] 59.62% | 260 | 3.5% |
[ 60.5% - 61.0% ] 60.74% | 298 | 17.9% |
[ 61.0% - 61.5% ] 61.16% | 1,138 | 1.7% |
[ 61.5% - 62.0% ] 61.82% | 165 | 4.2% |
[ 62.0% - 62.5% ] 62.31% | 719 | 4.1% |
[ 62.5% - 63.0% ] 62.73% | 1,913 | 1.9% |
[ 63.0% - 63.5% ] 63.20% | 1,174 | 2.9% |
[ 63.5% - 64.0% ] 63.51% | 74 | 3.7% |
[ 64.5% - 65.0% ] 64.87% | 316 | 4.4% |
[ 65.0% - 65.5% ] 65.45% | 55 | 6.2% |
[ 65.5% - 66.0% ] 65.93% | 91 | 34.1% |
[ 66.5% - 67.0% ] 66.67% | 210 | 13.3% |
[ 67.0% - 67.5% ] 67.17% | 265 | 2.8% |
[ 68.0% - 68.5% ] 68.42% | 114 | 5.6% |
[ 68.5% - 69.0% ] 68.77% | 397 | 13.6% |
[ 69.0% - 69.5% ] 69.39% | 49 | 2.0% |
[ 70.5% - 71.0% ] 70.87% | 690 | 0.44% |
[ 71.5% - 72.0% ] 71.63% | 141 | 4.3% |
[ 72.5% - 73.0% ] 72.73% | 11 | 27.3% |
[ 74.0% - 74.5% ] 74.05% | 131 | 38.9% |
[ 75.0% - 75.5% ] 75.00% | 64 | 1.8% |
[ 76.0% - 76.5% ] 76.26% | 813 | 34.8% |
[ 78.0% - 78.5% ] 78.05% | 82 | 25.6% |
[ 80.0% - 80.5% ] 80.08% | 502 | 29.9% |
[ 83.0% - 83.5% ] 83.16% | 95 | 3.8% |
[ 93.0% - 93.5% ] 93.48% | 138 | 42.0% |
[ 94.5% - 95.0% ] 94.51% | 510 | 2.7% |