Comanche Self-Care Disability
COMPARE
Comanche
Select to Compare
Self-Care Disability
Comanche Self-Care Disability
2.9%
SELF-CARE DISABILITY
0.0/ 100
METRIC RATING
322nd/ 347
METRIC RANK
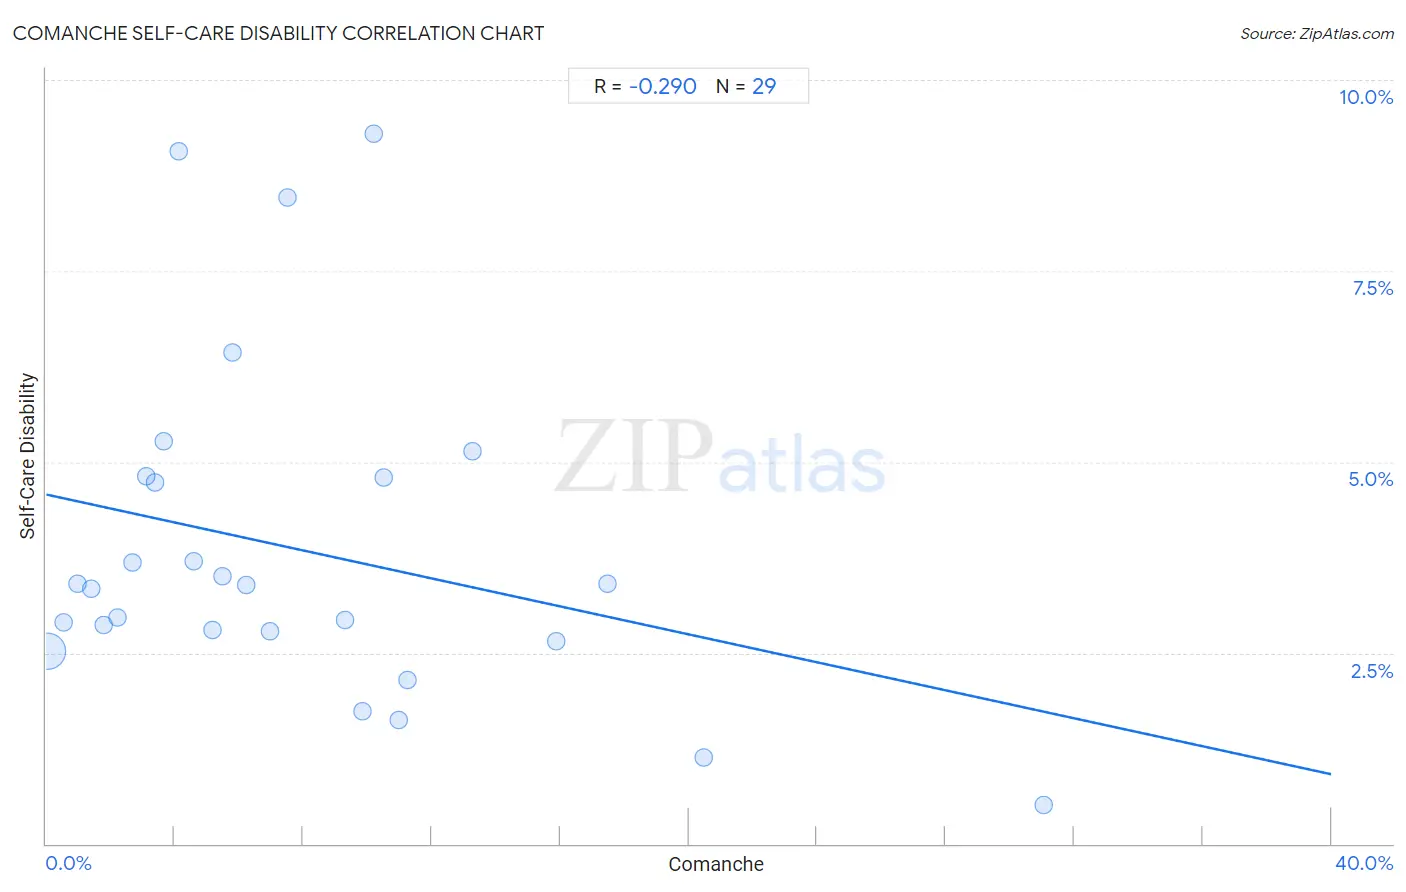
Comanche Self-Care Disability Correlation Chart
The statistical analysis conducted on geographies consisting of 109,703,809 people shows a weak negative correlation between the proportion of Comanche and percentage of population with self-care disability in the United States with a correlation coefficient (R) of -0.290 and weighted average of 2.9%. On average, for every 1% (one percent) increase in Comanche within a typical geography, there is a decrease of 0.092% in percentage of population with self-care disability.
It is essential to understand that the correlation between the percentage of Comanche and percentage of population with self-care disability does not imply a direct cause-and-effect relationship. It remains uncertain whether the presence of Comanche influences an upward or downward trend in the level of percentage of population with self-care disability within an area, or if Comanche simply ended up residing in those areas with higher or lower levels of percentage of population with self-care disability due to other factors.
Demographics Similar to Comanche by Self-Care Disability
In terms of self-care disability, the demographic groups most similar to Comanche are Seminole (2.9%, a difference of 0.12%), Cherokee (2.9%, a difference of 0.22%), Navajo (2.9%, a difference of 0.32%), Chickasaw (2.9%, a difference of 0.47%), and Spanish American Indian (2.9%, a difference of 0.69%).
| Demographics | Rating | Rank | Self-Care Disability |
| Immigrants from Cuba | 0.0 /100 | #315 | Tragic 2.8% |
| Menominee | 0.0 /100 | #316 | Tragic 2.8% |
| Immigrants from Dominica | 0.0 /100 | #317 | Tragic 2.8% |
| Assyrians/Chaldeans/Syriacs | 0.0 /100 | #318 | Tragic 2.8% |
| Spanish American Indians | 0.0 /100 | #319 | Tragic 2.9% |
| Chickasaw | 0.0 /100 | #320 | Tragic 2.9% |
| Navajo | 0.0 /100 | #321 | Tragic 2.9% |
| Comanche | 0.0 /100 | #322 | Tragic 2.9% |
| Seminole | 0.0 /100 | #323 | Tragic 2.9% |
| Cherokee | 0.0 /100 | #324 | Tragic 2.9% |
| Immigrants from Uzbekistan | 0.0 /100 | #325 | Tragic 2.9% |
| Paiute | 0.0 /100 | #326 | Tragic 2.9% |
| Blacks/African Americans | 0.0 /100 | #327 | Tragic 2.9% |
| Hopi | 0.0 /100 | #328 | Tragic 2.9% |
| Cajuns | 0.0 /100 | #329 | Tragic 2.9% |
Comanche Self-Care Disability Correlation Summary
| Measurement | Comanche Data | Self-Care Disability Data |
| Minimum | 0.034% | 0.50% |
| Maximum | 31.0% | 9.3% |
| Range | 31.0% | 8.8% |
| Mean | 7.8% | 3.9% |
| Median | 5.8% | 3.4% |
| Interquartile 25% (IQ1) | 2.9% | 2.7% |
| Interquartile 75% (IQ3) | 10.8% | 4.8% |
| Interquartile Range (IQR) | 7.8% | 2.1% |
| Standard Deviation (Sample) | 6.9% | 2.2% |
| Standard Deviation (Population) | 6.8% | 2.1% |
Correlation Details
| Comanche Percentile | Sample Size | Self-Care Disability |
[ 0.0% - 0.5% ] 0.034% | 108,032,883 | 2.5% |
[ 0.5% - 1.0% ] 0.53% | 1,127,328 | 2.9% |
[ 0.5% - 1.0% ] 0.98% | 164,630 | 3.4% |
[ 1.0% - 1.5% ] 1.39% | 55,347 | 3.3% |
[ 1.5% - 2.0% ] 1.79% | 35,404 | 2.9% |
[ 2.0% - 2.5% ] 2.22% | 13,959 | 3.0% |
[ 2.5% - 3.0% ] 2.70% | 155,006 | 3.7% |
[ 3.0% - 3.5% ] 3.12% | 35,008 | 4.8% |
[ 3.0% - 3.5% ] 3.39% | 6,578 | 4.7% |
[ 3.5% - 4.0% ] 3.65% | 25,958 | 5.3% |
[ 4.0% - 4.5% ] 4.11% | 1,654 | 9.1% |
[ 4.5% - 5.0% ] 4.61% | 4,145 | 3.7% |
[ 5.0% - 5.5% ] 5.18% | 4,966 | 2.8% |
[ 5.5% - 6.0% ] 5.50% | 9,636 | 3.5% |
[ 5.5% - 6.0% ] 5.78% | 2,994 | 6.4% |
[ 6.0% - 6.5% ] 6.23% | 6,086 | 3.4% |
[ 6.5% - 7.0% ] 6.98% | 2,520 | 2.8% |
[ 7.0% - 7.5% ] 7.49% | 3,230 | 8.5% |
[ 9.0% - 9.5% ] 9.29% | 312 | 2.9% |
[ 9.5% - 10.0% ] 9.83% | 2,563 | 1.7% |
[ 10.0% - 10.5% ] 10.20% | 49 | 9.3% |
[ 10.5% - 11.0% ] 10.52% | 4,867 | 4.8% |
[ 10.5% - 11.0% ] 10.99% | 1,438 | 1.6% |
[ 11.0% - 11.5% ] 11.26% | 1,377 | 2.1% |
[ 13.0% - 13.5% ] 13.27% | 1,341 | 5.1% |
[ 15.5% - 16.0% ] 15.87% | 2,974 | 2.6% |
[ 17.0% - 17.5% ] 17.46% | 1,065 | 3.4% |
[ 20.0% - 20.5% ] 20.49% | 288 | 1.1% |
[ 31.0% - 31.5% ] 31.03% | 203 | 0.50% |