Seminole Self-Care Disability
COMPARE
Seminole
Select to Compare
Self-Care Disability
Seminole Self-Care Disability
2.9%
SELF-CARE DISABILITY
0.0/ 100
METRIC RATING
323rd/ 347
METRIC RANK
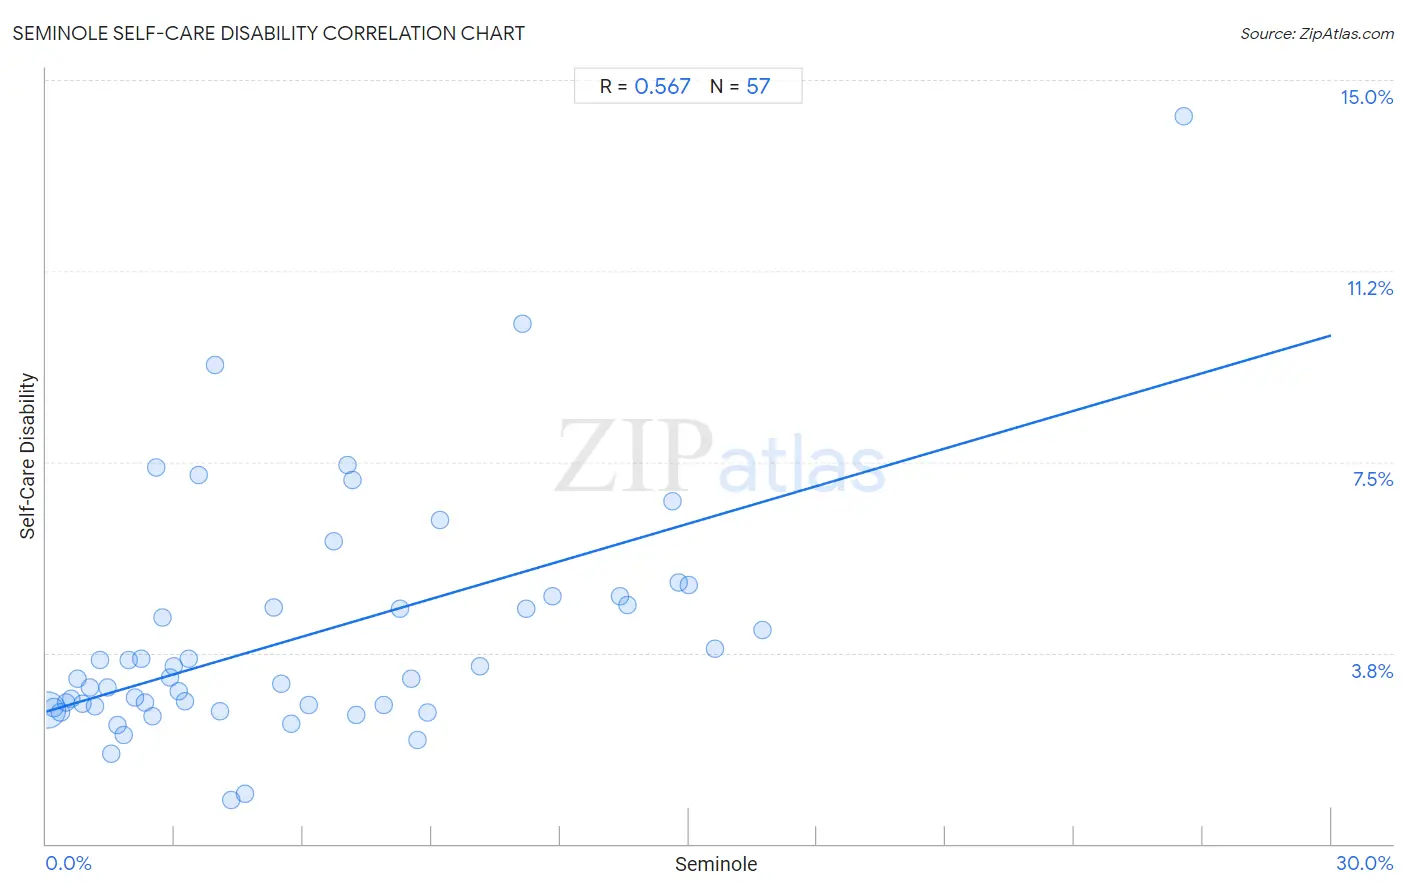
Seminole Self-Care Disability Correlation Chart
The statistical analysis conducted on geographies consisting of 118,265,141 people shows a substantial positive correlation between the proportion of Seminole and percentage of population with self-care disability in the United States with a correlation coefficient (R) of 0.567 and weighted average of 2.9%. On average, for every 1% (one percent) increase in Seminole within a typical geography, there is an increase of 0.25% in percentage of population with self-care disability.
It is essential to understand that the correlation between the percentage of Seminole and percentage of population with self-care disability does not imply a direct cause-and-effect relationship. It remains uncertain whether the presence of Seminole influences an upward or downward trend in the level of percentage of population with self-care disability within an area, or if Seminole simply ended up residing in those areas with higher or lower levels of percentage of population with self-care disability due to other factors.
Demographics Similar to Seminole by Self-Care Disability
In terms of self-care disability, the demographic groups most similar to Seminole are Cherokee (2.9%, a difference of 0.10%), Comanche (2.9%, a difference of 0.12%), Navajo (2.9%, a difference of 0.45%), Chickasaw (2.9%, a difference of 0.60%), and Immigrants from Uzbekistan (2.9%, a difference of 0.63%).
| Demographics | Rating | Rank | Self-Care Disability |
| Menominee | 0.0 /100 | #316 | Tragic 2.8% |
| Immigrants from Dominica | 0.0 /100 | #317 | Tragic 2.8% |
| Assyrians/Chaldeans/Syriacs | 0.0 /100 | #318 | Tragic 2.8% |
| Spanish American Indians | 0.0 /100 | #319 | Tragic 2.9% |
| Chickasaw | 0.0 /100 | #320 | Tragic 2.9% |
| Navajo | 0.0 /100 | #321 | Tragic 2.9% |
| Comanche | 0.0 /100 | #322 | Tragic 2.9% |
| Seminole | 0.0 /100 | #323 | Tragic 2.9% |
| Cherokee | 0.0 /100 | #324 | Tragic 2.9% |
| Immigrants from Uzbekistan | 0.0 /100 | #325 | Tragic 2.9% |
| Paiute | 0.0 /100 | #326 | Tragic 2.9% |
| Blacks/African Americans | 0.0 /100 | #327 | Tragic 2.9% |
| Hopi | 0.0 /100 | #328 | Tragic 2.9% |
| Cajuns | 0.0 /100 | #329 | Tragic 2.9% |
| Nepalese | 0.0 /100 | #330 | Tragic 3.0% |
Seminole Self-Care Disability Correlation Summary
| Measurement | Seminole Data | Self-Care Disability Data |
| Minimum | 0.021% | 0.86% |
| Maximum | 26.6% | 14.3% |
| Range | 26.5% | 13.4% |
| Mean | 6.0% | 4.1% |
| Median | 4.0% | 3.2% |
| Interquartile 25% (IQ1) | 1.9% | 2.7% |
| Interquartile 75% (IQ3) | 8.8% | 4.8% |
| Interquartile Range (IQR) | 6.9% | 2.1% |
| Standard Deviation (Sample) | 5.4% | 2.4% |
| Standard Deviation (Population) | 5.4% | 2.3% |
Correlation Details
| Seminole Percentile | Sample Size | Self-Care Disability |
[ 0.0% - 0.5% ] 0.021% | 107,211,874 | 2.6% |
[ 0.0% - 0.5% ] 0.18% | 6,378,381 | 2.7% |
[ 0.0% - 0.5% ] 0.33% | 2,256,309 | 2.6% |
[ 0.0% - 0.5% ] 0.46% | 920,702 | 2.8% |
[ 0.5% - 1.0% ] 0.58% | 465,118 | 2.8% |
[ 0.5% - 1.0% ] 0.73% | 193,618 | 3.2% |
[ 0.5% - 1.0% ] 0.84% | 151,779 | 2.7% |
[ 1.0% - 1.5% ] 1.02% | 124,575 | 3.1% |
[ 1.0% - 1.5% ] 1.13% | 179,231 | 2.7% |
[ 1.0% - 1.5% ] 1.25% | 63,479 | 3.6% |
[ 1.0% - 1.5% ] 1.42% | 30,407 | 3.1% |
[ 1.5% - 2.0% ] 1.52% | 14,866 | 1.8% |
[ 1.5% - 2.0% ] 1.67% | 25,341 | 2.3% |
[ 1.5% - 2.0% ] 1.81% | 61,754 | 2.1% |
[ 1.5% - 2.0% ] 1.92% | 7,561 | 3.6% |
[ 2.0% - 2.5% ] 2.07% | 41,194 | 2.9% |
[ 2.0% - 2.5% ] 2.22% | 22,114 | 3.6% |
[ 2.0% - 2.5% ] 2.30% | 22,869 | 2.8% |
[ 2.0% - 2.5% ] 2.48% | 6,282 | 2.5% |
[ 2.5% - 3.0% ] 2.58% | 1,358 | 7.4% |
[ 2.5% - 3.0% ] 2.72% | 4,003 | 4.4% |
[ 2.5% - 3.0% ] 2.90% | 9,350 | 3.3% |
[ 2.5% - 3.0% ] 2.96% | 6,920 | 3.5% |
[ 3.0% - 3.5% ] 3.11% | 9,976 | 3.0% |
[ 3.0% - 3.5% ] 3.23% | 4,178 | 2.8% |
[ 3.0% - 3.5% ] 3.33% | 60 | 3.6% |
[ 3.5% - 4.0% ] 3.56% | 3,964 | 7.3% |
[ 3.5% - 4.0% ] 3.93% | 280 | 9.4% |
[ 4.0% - 4.5% ] 4.05% | 2,422 | 2.6% |
[ 4.0% - 4.5% ] 4.31% | 116 | 0.86% |
[ 4.5% - 5.0% ] 4.63% | 216 | 0.98% |
[ 5.0% - 5.5% ] 5.32% | 1,110 | 4.6% |
[ 5.0% - 5.5% ] 5.48% | 292 | 3.1% |
[ 5.5% - 6.0% ] 5.71% | 403 | 2.4% |
[ 6.0% - 6.5% ] 6.12% | 245 | 2.7% |
[ 6.5% - 7.0% ] 6.72% | 1,086 | 5.9% |
[ 7.0% - 7.5% ] 7.03% | 313 | 7.4% |
[ 7.0% - 7.5% ] 7.14% | 168 | 7.1% |
[ 7.0% - 7.5% ] 7.23% | 1,190 | 2.5% |
[ 7.5% - 8.0% ] 7.89% | 1,166 | 2.7% |
[ 8.0% - 8.5% ] 8.25% | 1,805 | 4.6% |
[ 8.5% - 9.0% ] 8.51% | 188 | 3.2% |
[ 8.5% - 9.0% ] 8.67% | 2,019 | 2.0% |
[ 8.5% - 9.0% ] 8.89% | 405 | 2.6% |
[ 9.0% - 9.5% ] 9.20% | 174 | 6.4% |
[ 10.0% - 10.5% ] 10.11% | 445 | 3.5% |
[ 11.0% - 11.5% ] 11.11% | 54 | 10.2% |
[ 11.0% - 11.5% ] 11.19% | 12,329 | 4.6% |
[ 11.5% - 12.0% ] 11.83% | 372 | 4.9% |
[ 13.0% - 13.5% ] 13.40% | 2,887 | 4.9% |
[ 13.5% - 14.0% ] 13.57% | 5,578 | 4.7% |
[ 14.5% - 15.0% ] 14.63% | 1,169 | 6.7% |
[ 14.5% - 15.0% ] 14.77% | 7,144 | 5.1% |
[ 15.0% - 15.5% ] 15.01% | 3,124 | 5.1% |
[ 15.5% - 16.0% ] 15.60% | 564 | 3.8% |
[ 16.5% - 17.0% ] 16.73% | 550 | 4.2% |
[ 26.5% - 27.0% ] 26.56% | 64 | 14.3% |