Pima Self-Care Disability

COMPARE

Pima
Race
Ancestry
AfghanAfricanAlaska NativeAlaskan AthabascanAlbanianAleutAlsatianAmericanApacheArabArapahoArgentineanArmenianAssyrian/Chaldean/SyriacAustralianAustrianBahamianBangladeshiBarbadianBasqueBelgianBelizeanBermudanBhutaneseBlackfeetBolivianBrazilianBritishBritish West IndianBulgarianBurmeseCajunCambodianCanadianCape VerdeanCarpatho RusynCelticCentral AmericanCentral American IndianCherokeeCheyenneChickasawChileanChineseChippewaChoctawColombianColvilleComancheCosta RicanCreeCreekCroatianCrowCubanCypriotCzechCzechoslovakianDanishDelawareDominicanDutchDutch West IndianEastern EuropeanEcuadorianEgyptianEnglishEstonianEthiopianEuropeanFijianFilipinoFinnishFrenchFrench American IndianFrench CanadianGermanGerman RussianGhanaianGreekGuamanian/ChamorroGuatemalanGuyaneseHaitianHmongHonduranHopiHoumaHungarianIcelanderIndian (Asian)IndonesianInupiatIranianIraqiIrishIroquoisIsraeliItalianJamaicanJapaneseJordanianKenyanKiowaKoreanLaotianLatvianLebaneseLiberianLithuanianLumbeeLuxembourgerMacedonianMalaysianMalteseMarshalleseMenomineeMexicanMexican American IndianMongolianMoroccanNative HawaiianNavajoNepaleseNew ZealanderNicaraguanNigerianNorthern EuropeanNorwegianOkinawanOsageOttawaPaiutePakistaniPalestinianPanamanianParaguayanPennsylvania GermanPeruvianPimaPolishPortuguesePotawatomiPuebloPuerto RicanPuget Sound SalishRomanianRussianSalvadoranSamoanScandinavianScotch-IrishScottishSeminoleSenegaleseSerbianShoshoneSierra LeoneanSiouxSlavicSlovakSloveneSomaliSouth AfricanSouth AmericanSouth American IndianSoviet UnionSpaniardSpanishSpanish AmericanSpanish American IndianSri LankanSubsaharan AfricanSudaneseSwedishSwissSyrianTaiwaneseThaiTlingit-HaidaTohono O'OdhamTonganTrinidadian and TobagonianTsimshianTurkishU.S. Virgin IslanderUgandanUkrainianUruguayanUteVenezuelanVietnameseWelshWest IndianYakamaYaquiYugoslavianYumanYup'ikZimbabwean
Immigration
NonimmigrantsImmigrantsAfghanistanAfricaAlbaniaArgentinaArmeniaAsiaAustraliaAustriaBahamasBangladeshBarbadosBelarusBelgiumBelizeBoliviaBosnia and HerzegovinaBrazilBulgariaBurma/MyanmarCabo VerdeCambodiaCameroonCanadaCaribbeanCentral AmericaChileChinaColombiaCongoCosta RicaCroatiaCubaCzechoslovakiaDenmarkDominicaDominican RepublicEastern AfricaEastern AsiaEastern EuropeEcuadorEgyptEl SalvadorEnglandEritreaEthiopiaEuropeFijiFranceGermanyGhanaGreeceGrenadaGuatemalaGuyanaHaitiHondurasHong KongHungaryIndiaIndonesiaIranIraqIrelandIsraelItalyJamaicaJapanJordanKazakhstanKenyaKoreaKuwaitLaosLatin AmericaLatviaLebanonLiberiaLithuaniaMalaysiaMexicoMicronesiaMiddle AfricaMoldovaMoroccoNepalNetherlandsNicaraguaNigeriaNorth AmericaNorth MacedoniaNorthern AfricaNorthern EuropeNorwayOceaniaPakistanPanamaPeruPhilippinesPolandPortugalRomaniaRussiaSaudi ArabiaScotlandSenegalSerbiaSierra LeoneSingaporeSomaliaSouth AfricaSouth AmericaSouth Central AsiaSouth Eastern AsiaSouthern EuropeSpainSri LankaSt. Vincent and the GrenadinesSudanSwedenSwitzerlandSyriaTaiwanThailandTrinidad and TobagoTurkeyUgandaUkraineUruguayUzbekistanVenezuelaVietnamWest IndiesWestern AfricaWestern AsiaWestern EuropeYemenZaireZimbabweAzores
Select to Compare
Race
Ancestry
AfghanAfricanAlaska NativeAlaskan AthabascanAlbanianAleutAlsatianAmericanApacheArabArapahoArgentineanArmenianAssyrian/Chaldean/SyriacAustralianAustrianBahamianBangladeshiBarbadianBasqueBelgianBelizeanBermudanBhutaneseBlackfeetBolivianBrazilianBritishBritish West IndianBulgarianBurmeseCajunCambodianCanadianCape VerdeanCarpatho RusynCelticCentral AmericanCentral American IndianCherokeeCheyenneChickasawChileanChineseChippewaChoctawColombianColvilleComancheCosta RicanCreeCreekCroatianCrowCubanCypriotCzechCzechoslovakianDanishDelawareDominicanDutchDutch West IndianEastern EuropeanEcuadorianEgyptianEnglishEstonianEthiopianEuropeanFijianFilipinoFinnishFrenchFrench American IndianFrench CanadianGermanGerman RussianGhanaianGreekGuamanian/ChamorroGuatemalanGuyaneseHaitianHmongHonduranHopiHoumaHungarianIcelanderIndian (Asian)IndonesianInupiatIranianIraqiIrishIroquoisIsraeliItalianJamaicanJapaneseJordanianKenyanKiowaKoreanLaotianLatvianLebaneseLiberianLithuanianLumbeeLuxembourgerMacedonianMalaysianMalteseMarshalleseMenomineeMexicanMexican American IndianMongolianMoroccanNative HawaiianNavajoNepaleseNew ZealanderNicaraguanNigerianNorthern EuropeanNorwegianOkinawanOsageOttawaPaiutePakistaniPalestinianPanamanianParaguayanPennsylvania GermanPeruvianPolishPortuguesePotawatomiPuebloPuerto RicanPuget Sound SalishRomanianRussianSalvadoranSamoanScandinavianScotch-IrishScottishSeminoleSenegaleseSerbianShoshoneSierra LeoneanSiouxSlavicSlovakSloveneSomaliSouth AfricanSouth AmericanSouth American IndianSoviet UnionSpaniardSpanishSpanish AmericanSpanish American IndianSri LankanSubsaharan AfricanSudaneseSwedishSwissSyrianTaiwaneseThaiTlingit-HaidaTohono O'OdhamTonganTrinidadian and TobagonianTsimshianTurkishU.S. Virgin IslanderUgandanUkrainianUruguayanUteVenezuelanVietnameseWelshWest IndianYakamaYaquiYugoslavianYumanYup'ikZimbabwean
Immigration
NonimmigrantsImmigrantsAfghanistanAfricaAlbaniaArgentinaArmeniaAsiaAustraliaAustriaBahamasBangladeshBarbadosBelarusBelgiumBelizeBoliviaBosnia and HerzegovinaBrazilBulgariaBurma/MyanmarCabo VerdeCambodiaCameroonCanadaCaribbeanCentral AmericaChileChinaColombiaCongoCosta RicaCroatiaCubaCzechoslovakiaDenmarkDominicaDominican RepublicEastern AfricaEastern AsiaEastern EuropeEcuadorEgyptEl SalvadorEnglandEritreaEthiopiaEuropeFijiFranceGermanyGhanaGreeceGrenadaGuatemalaGuyanaHaitiHondurasHong KongHungaryIndiaIndonesiaIranIraqIrelandIsraelItalyJamaicaJapanJordanKazakhstanKenyaKoreaKuwaitLaosLatin AmericaLatviaLebanonLiberiaLithuaniaMalaysiaMexicoMicronesiaMiddle AfricaMoldovaMoroccoNepalNetherlandsNicaraguaNigeriaNorth AmericaNorth MacedoniaNorthern AfricaNorthern EuropeNorwayOceaniaPakistanPanamaPeruPhilippinesPolandPortugalRomaniaRussiaSaudi ArabiaScotlandSenegalSerbiaSierra LeoneSingaporeSomaliaSouth AfricaSouth AmericaSouth Central AsiaSouth Eastern AsiaSouthern EuropeSpainSri LankaSt. Vincent and the GrenadinesSudanSwedenSwitzerlandSyriaTaiwanThailandTrinidad and TobagoTurkeyUgandaUkraineUruguayUzbekistanVenezuelaVietnamWest IndiesWestern AfricaWestern AsiaWestern EuropeYemenZaireZimbabweAzores
Self-Care Disability
Income
Poverty
Unemployment
Labor Participation
Family Structure
Vehicle Availability
Education Level
Disability

Pima Self-Care Disability
Tragic

2.8%
SELF-CARE DISABILITY
0.0/ 100
METRIC RATING
301st/ 347
METRIC RANK

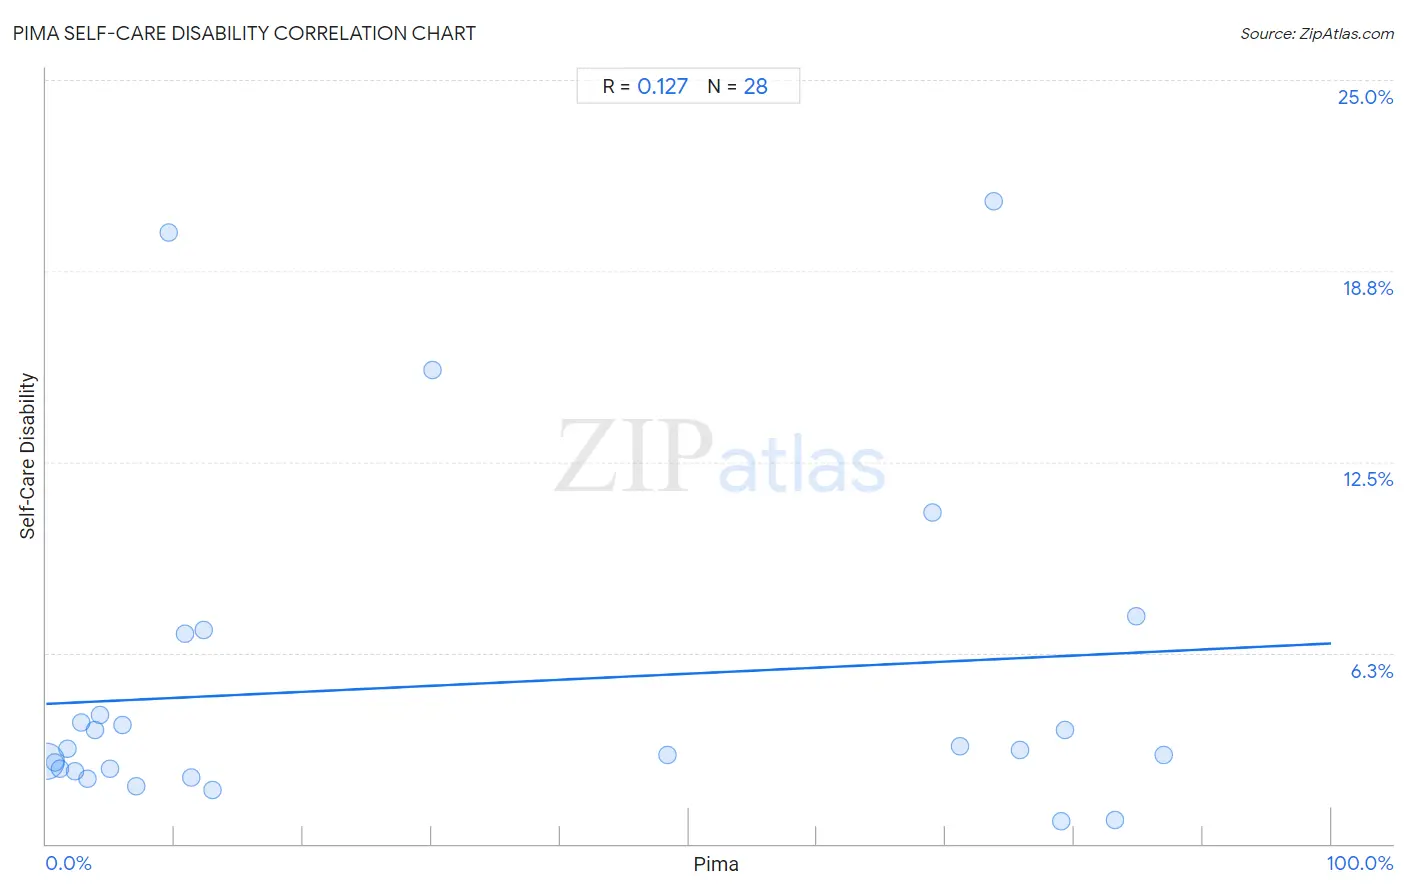
Pima Self-Care Disability Correlation Chart

The statistical analysis conducted on geographies consisting of 61,528,546 people shows a poor positive correlation between the proportion of Pima and percentage of population with self-care disability in the United States with a correlation coefficient (R) of 0.127 and weighted average of 2.8%. On average, for every 1% (one percent) increase in Pima within a typical geography, there is an increase of 0.020% in percentage of population with self-care disability.
Pima Self-Care Disability
It is essential to understand that the correlation between the percentage of Pima and percentage of population with self-care disability does not imply a direct cause-and-effect relationship. It remains uncertain whether the presence of Pima influences an upward or downward trend in the level of percentage of population with self-care disability within an area, or if Pima simply ended up residing in those areas with higher or lower levels of percentage of population with self-care disability due to other factors.

Demographics Similar to Pima by Self-Care Disability

In terms of self-care disability, the demographic groups most similar to Pima are Immigrants from St. Vincent and the Grenadines (2.8%, a difference of 0.040%), Immigrants from Fiji (2.8%, a difference of 0.090%), Immigrants from Belize (2.8%, a difference of 0.18%), Cree (2.8%, a difference of 0.34%), and Immigrants from West Indies (2.8%, a difference of 0.39%).
DemographicsRating | RankSelf-Care Disability
Blackfeet
0.0
/100
|
#294
Tragic
2.7%
Barbadians
0.0
/100
|
#295
Tragic
2.7%
Immigrants from Portugal
0.0
/100
|
#296
Tragic
2.8%
West Indians
0.0
/100
|
#297
Tragic
2.8%
Americans
0.0
/100
|
#298
Tragic
2.8%
Immigrants from Guyana
0.0
/100
|
#299
Tragic
2.8%
Immigrants from Fiji
0.0
/100
|
#300
Tragic
2.8%
Pima
0.0
/100
|
#301
Tragic
2.8%
Immigrants from St. Vincent and the Grenadines
0.0
/100
|
#302
Tragic
2.8%
Immigrants from Belize
0.0
/100
|
#303
Tragic
2.8%
Cree
0.0
/100
|
#304
Tragic
2.8%
Immigrants from West Indies
0.0
/100
|
#305
Tragic
2.8%
Aleuts
0.0
/100
|
#306
Tragic
2.8%
Natives/Alaskans
0.0
/100
|
#307
Tragic
2.8%
Immigrants from Grenada
0.0
/100
|
#308
Tragic
2.8%

Pima Self-Care Disability Correlation Summary

MeasurementPima DataSelf-Care Disability Data
Minimum0.038%0.75%
Maximum87.0%21.0%
Range86.9%20.3%
Mean31.3%5.2%
Median11.0%3.1%
Interquartile 25% (IQ1)3.5%2.4%
Interquartile 75% (IQ3)72.4%5.5%
Interquartile Range (IQR)69.0%3.1%
Standard Deviation (Sample)34.4%5.3%
Standard Deviation (Population)33.7%5.2%

Correlation Details

Pima PercentileSample SizeSelf-Care Disability
[
0.0%
-
0.5%
]
0.038%
60,533,6112.7%
[
0.5%
-
1.0%
]
0.71%
537,7592.7%
[
1.0%
-
1.5%
]
1.10%
224,3722.4%
[
1.5%
-
2.0%
]
1.66%
64,2803.1%
[
2.0%
-
2.5%
]
2.23%
53,0542.4%
[
2.5%
-
3.0%
]
2.76%
5,0784.0%
[
3.0%
-
3.5%
]
3.20%
7,2782.1%
[
3.5%
-
4.0%
]
3.77%
3,4263.7%
[
4.0%
-
4.5%
]
4.15%
5,8364.2%
[
4.5%
-
5.0%
]
4.99%
51,1562.5%
[
5.5%
-
6.0%
]
5.92%
2,0273.9%
[
7.0%
-
7.5%
]
7.01%
1,3701.9%
[
9.5%
-
10.0%
]
9.57%
11520.0%
[
10.5%
-
11.0%
]
10.78%
1026.9%
[
11.0%
-
11.5%
]
11.29%
17,6592.2%
[
12.0%
-
12.5%
]
12.28%
1,2707.0%
[
12.5%
-
13.0%
]
12.92%
3871.8%
[
30.0%
-
30.5%
]
30.03%
38315.5%
[
48.0%
-
48.5%
]
48.39%
9652.9%
[
68.5%
-
69.0%
]
68.98%
33210.8%
[
71.0%
-
71.5%
]
71.13%
4783.2%
[
73.5%
-
74.0%
]
73.77%
38521.0%
[
75.5%
-
76.0%
]
75.80%
1,8353.1%
[
78.5%
-
79.0%
]
78.99%
2,7130.75%
[
79.0%
-
79.5%
]
79.26%
4,5383.7%
[
83.0%
-
83.5%
]
83.14%
4,1390.78%
[
84.5%
-
85.0%
]
84.86%
7337.4%
[
86.5%
-
87.0%
]
86.98%
3,2652.9%