Scotch-Irish Child Poverty Under the Age of 5

COMPARE

Scotch-Irish
Race
Ancestry
AfghanAfricanAlaska NativeAlaskan AthabascanAlbanianAleutAlsatianAmericanApacheArabArapahoArgentineanArmenianAssyrian/Chaldean/SyriacAustralianAustrianBahamianBangladeshiBarbadianBasqueBelgianBelizeanBermudanBhutaneseBlackfeetBolivianBrazilianBritishBritish West IndianBulgarianBurmeseCajunCambodianCanadianCape VerdeanCarpatho RusynCelticCentral AmericanCentral American IndianCherokeeCheyenneChickasawChileanChineseChippewaChoctawColombianColvilleComancheCosta RicanCreeCreekCroatianCrowCubanCypriotCzechCzechoslovakianDanishDelawareDominicanDutchDutch West IndianEastern EuropeanEcuadorianEgyptianEnglishEstonianEthiopianEuropeanFijianFilipinoFinnishFrenchFrench American IndianFrench CanadianGermanGerman RussianGhanaianGreekGuamanian/ChamorroGuatemalanGuyaneseHaitianHmongHonduranHopiHoumaHungarianIcelanderIndian (Asian)IndonesianInupiatIranianIraqiIrishIroquoisIsraeliItalianJamaicanJapaneseJordanianKenyanKiowaKoreanLaotianLatvianLebaneseLiberianLithuanianLumbeeLuxembourgerMacedonianMalaysianMalteseMarshalleseMenomineeMexicanMexican American IndianMongolianMoroccanNative HawaiianNavajoNepaleseNew ZealanderNicaraguanNigerianNorthern EuropeanNorwegianOkinawanOsageOttawaPaiutePakistaniPalestinianPanamanianParaguayanPennsylvania GermanPeruvianPimaPolishPortuguesePotawatomiPuebloPuerto RicanPuget Sound SalishRomanianRussianSalvadoranSamoanScandinavianScotch-IrishScottishSeminoleSenegaleseSerbianShoshoneSierra LeoneanSiouxSlavicSlovakSloveneSomaliSouth AfricanSouth AmericanSouth American IndianSoviet UnionSpaniardSpanishSpanish AmericanSpanish American IndianSri LankanSubsaharan AfricanSudaneseSwedishSwissSyrianTaiwaneseThaiTlingit-HaidaTohono O'OdhamTonganTrinidadian and TobagonianTsimshianTurkishU.S. Virgin IslanderUgandanUkrainianUruguayanUteVenezuelanVietnameseWelshWest IndianYakamaYaquiYugoslavianYumanYup'ikZimbabwean
Immigration
NonimmigrantsImmigrantsAfghanistanAfricaAlbaniaArgentinaArmeniaAsiaAustraliaAustriaBahamasBangladeshBarbadosBelarusBelgiumBelizeBoliviaBosnia and HerzegovinaBrazilBulgariaBurma/MyanmarCabo VerdeCambodiaCameroonCanadaCaribbeanCentral AmericaChileChinaColombiaCongoCosta RicaCroatiaCubaCzechoslovakiaDenmarkDominicaDominican RepublicEastern AfricaEastern AsiaEastern EuropeEcuadorEgyptEl SalvadorEnglandEritreaEthiopiaEuropeFijiFranceGermanyGhanaGreeceGrenadaGuatemalaGuyanaHaitiHondurasHong KongHungaryIndiaIndonesiaIranIraqIrelandIsraelItalyJamaicaJapanJordanKazakhstanKenyaKoreaKuwaitLaosLatin AmericaLatviaLebanonLiberiaLithuaniaMalaysiaMexicoMicronesiaMiddle AfricaMoldovaMoroccoNepalNetherlandsNicaraguaNigeriaNorth AmericaNorth MacedoniaNorthern AfricaNorthern EuropeNorwayOceaniaPakistanPanamaPeruPhilippinesPolandPortugalRomaniaRussiaSaudi ArabiaScotlandSenegalSerbiaSierra LeoneSingaporeSomaliaSouth AfricaSouth AmericaSouth Central AsiaSouth Eastern AsiaSouthern EuropeSpainSri LankaSt. Vincent and the GrenadinesSudanSwedenSwitzerlandSyriaTaiwanThailandTrinidad and TobagoTurkeyUgandaUkraineUruguayUzbekistanVenezuelaVietnamWest IndiesWestern AfricaWestern AsiaWestern EuropeYemenZaireZimbabweAzores
Select to Compare
Race
Ancestry
AfghanAfricanAlaska NativeAlaskan AthabascanAlbanianAleutAlsatianAmericanApacheArabArapahoArgentineanArmenianAssyrian/Chaldean/SyriacAustralianAustrianBahamianBangladeshiBarbadianBasqueBelgianBelizeanBermudanBhutaneseBlackfeetBolivianBrazilianBritishBritish West IndianBulgarianBurmeseCajunCambodianCanadianCape VerdeanCarpatho RusynCelticCentral AmericanCentral American IndianCherokeeCheyenneChickasawChileanChineseChippewaChoctawColombianColvilleComancheCosta RicanCreeCreekCroatianCrowCubanCypriotCzechCzechoslovakianDanishDelawareDominicanDutchDutch West IndianEastern EuropeanEcuadorianEgyptianEnglishEstonianEthiopianEuropeanFijianFilipinoFinnishFrenchFrench American IndianFrench CanadianGermanGerman RussianGhanaianGreekGuamanian/ChamorroGuatemalanGuyaneseHaitianHmongHonduranHopiHoumaHungarianIcelanderIndian (Asian)IndonesianInupiatIranianIraqiIrishIroquoisIsraeliItalianJamaicanJapaneseJordanianKenyanKiowaKoreanLaotianLatvianLebaneseLiberianLithuanianLumbeeLuxembourgerMacedonianMalaysianMalteseMarshalleseMenomineeMexicanMexican American IndianMongolianMoroccanNative HawaiianNavajoNepaleseNew ZealanderNicaraguanNigerianNorthern EuropeanNorwegianOkinawanOsageOttawaPaiutePakistaniPalestinianPanamanianParaguayanPennsylvania GermanPeruvianPimaPolishPortuguesePotawatomiPuebloPuerto RicanPuget Sound SalishRomanianRussianSalvadoranSamoanScandinavianScottishSeminoleSenegaleseSerbianShoshoneSierra LeoneanSiouxSlavicSlovakSloveneSomaliSouth AfricanSouth AmericanSouth American IndianSoviet UnionSpaniardSpanishSpanish AmericanSpanish American IndianSri LankanSubsaharan AfricanSudaneseSwedishSwissSyrianTaiwaneseThaiTlingit-HaidaTohono O'OdhamTonganTrinidadian and TobagonianTsimshianTurkishU.S. Virgin IslanderUgandanUkrainianUruguayanUteVenezuelanVietnameseWelshWest IndianYakamaYaquiYugoslavianYumanYup'ikZimbabwean
Immigration
NonimmigrantsImmigrantsAfghanistanAfricaAlbaniaArgentinaArmeniaAsiaAustraliaAustriaBahamasBangladeshBarbadosBelarusBelgiumBelizeBoliviaBosnia and HerzegovinaBrazilBulgariaBurma/MyanmarCabo VerdeCambodiaCameroonCanadaCaribbeanCentral AmericaChileChinaColombiaCongoCosta RicaCroatiaCubaCzechoslovakiaDenmarkDominicaDominican RepublicEastern AfricaEastern AsiaEastern EuropeEcuadorEgyptEl SalvadorEnglandEritreaEthiopiaEuropeFijiFranceGermanyGhanaGreeceGrenadaGuatemalaGuyanaHaitiHondurasHong KongHungaryIndiaIndonesiaIranIraqIrelandIsraelItalyJamaicaJapanJordanKazakhstanKenyaKoreaKuwaitLaosLatin AmericaLatviaLebanonLiberiaLithuaniaMalaysiaMexicoMicronesiaMiddle AfricaMoldovaMoroccoNepalNetherlandsNicaraguaNigeriaNorth AmericaNorth MacedoniaNorthern AfricaNorthern EuropeNorwayOceaniaPakistanPanamaPeruPhilippinesPolandPortugalRomaniaRussiaSaudi ArabiaScotlandSenegalSerbiaSierra LeoneSingaporeSomaliaSouth AfricaSouth AmericaSouth Central AsiaSouth Eastern AsiaSouthern EuropeSpainSri LankaSt. Vincent and the GrenadinesSudanSwedenSwitzerlandSyriaTaiwanThailandTrinidad and TobagoTurkeyUgandaUkraineUruguayUzbekistanVenezuelaVietnamWest IndiesWestern AfricaWestern AsiaWestern EuropeYemenZaireZimbabweAzores
Child Poverty Under the Age of 5
Income
Poverty
Unemployment
Labor Participation
Family Structure
Vehicle Availability
Education Level
Disability

Scotch-Irish Child Poverty Under the Age of 5
Tragic

18.2%
POVERTY | CHILDREN < 5
9.8/ 100
METRIC RATING
208th/ 347
METRIC RANK

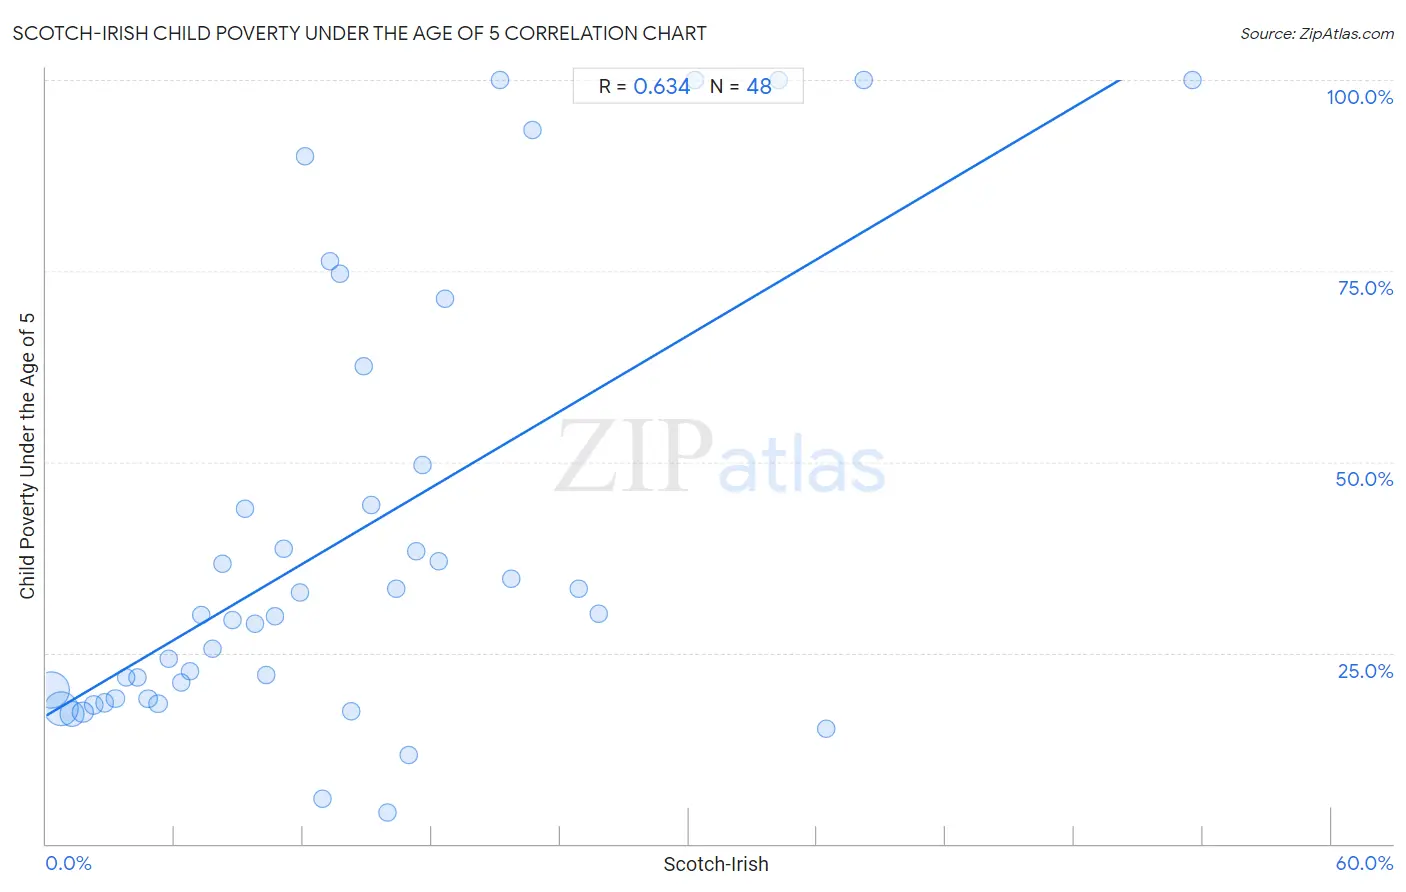
Scotch-Irish Child Poverty Under the Age of 5 Correlation Chart

The statistical analysis conducted on geographies consisting of 512,287,895 people shows a significant positive correlation between the proportion of Scotch-Irish and poverty level among children under the age of 5 in the United States with a correlation coefficient (R) of 0.634 and weighted average of 18.2%. On average, for every 1% (one percent) increase in Scotch-Irish within a typical geography, there is an increase of 1.7% in poverty level among children under the age of 5.
Scotch-Irish Child Poverty Under the Age of 5
It is essential to understand that the correlation between the percentage of Scotch-Irish and poverty level among children under the age of 5 does not imply a direct cause-and-effect relationship. It remains uncertain whether the presence of Scotch-Irish influences an upward or downward trend in the level of poverty level among children under the age of 5 within an area, or if Scotch-Irish simply ended up residing in those areas with higher or lower levels of poverty level among children under the age of 5 due to other factors.

Demographics Similar to Scotch-Irish by Child Poverty Under the Age of 5

In terms of child poverty under the age of 5, the demographic groups most similar to Scotch-Irish are Spanish (18.2%, a difference of 0.010%), Immigrants (18.2%, a difference of 0.020%), Panamanian (18.2%, a difference of 0.020%), Moroccan (18.2%, a difference of 0.11%), and Nepalese (18.3%, a difference of 0.32%).
DemographicsRating | RankChild Poverty Under the Age of 5
Ugandans
13.9
/100
|
#201
Poor
18.0%
Japanese
13.8
/100
|
#202
Poor
18.1%
Immigrants from Cambodia
13.7
/100
|
#203
Poor
18.1%
Immigrants from Eastern Africa
13.4
/100
|
#204
Poor
18.1%
Spaniards
12.8
/100
|
#205
Poor
18.1%
Whites/Caucasians
12.6
/100
|
#206
Poor
18.1%
Immigrants
9.9
/100
|
#207
Tragic
18.2%
Scotch-Irish
9.8
/100
|
#208
Tragic
18.2%
Spanish
9.8
/100
|
#209
Tragic
18.2%
Panamanians
9.7
/100
|
#210
Tragic
18.2%
Moroccans
9.4
/100
|
#211
Tragic
18.2%
Nepalese
8.7
/100
|
#212
Tragic
18.3%
Immigrants from Thailand
8.6
/100
|
#213
Tragic
18.3%
Malaysians
6.5
/100
|
#214
Tragic
18.4%
Immigrants from Panama
6.0
/100
|
#215
Tragic
18.5%

Scotch-Irish Child Poverty Under the Age of 5 Correlation Summary

MeasurementScotch-Irish DataChild Poverty Under the Age of 5 Data
Minimum0.25%4.1%
Maximum53.5%100.0%
Range53.3%95.9%
Mean14.0%39.9%
Median12.0%29.9%
Interquartile 25% (IQ1)6.0%19.0%
Interquartile 75% (IQ3)17.9%47.0%
Interquartile Range (IQR)11.9%28.1%
Standard Deviation (Sample)11.0%28.8%
Standard Deviation (Population)10.9%28.5%

Correlation Details

Scotch-Irish PercentileSample SizeChild Poverty Under the Age of 5
[
0.0%
-
0.5%
]
0.25%
199,382,95720.2%
[
0.5%
-
1.0%
]
0.72%
172,988,63117.7%
[
1.0%
-
1.5%
]
1.21%
76,342,18816.9%
[
1.5%
-
2.0%
]
1.71%
33,316,72417.2%
[
2.0%
-
2.5%
]
2.21%
14,030,65118.2%
[
2.5%
-
3.0%
]
2.73%
6,861,44618.5%
[
3.0%
-
3.5%
]
3.23%
4,403,57619.0%
[
3.5%
-
4.0%
]
3.76%
2,095,50421.8%
[
4.0%
-
4.5%
]
4.25%
983,76121.7%
[
4.5%
-
5.0%
]
4.76%
549,04818.9%
[
5.0%
-
5.5%
]
5.22%
520,08818.4%
[
5.5%
-
6.0%
]
5.72%
227,00424.2%
[
6.0%
-
6.5%
]
6.31%
135,27221.2%
[
6.5%
-
7.0%
]
6.71%
75,19522.6%
[
7.0%
-
7.5%
]
7.21%
69,57530.0%
[
7.5%
-
8.0%
]
7.79%
79,48225.6%
[
8.0%
-
8.5%
]
8.21%
30,59436.6%
[
8.5%
-
9.0%
]
8.73%
34,93229.3%
[
9.0%
-
9.5%
]
9.30%
15,02843.9%
[
9.5%
-
10.0%
]
9.76%
24,72428.8%
[
10.0%
-
10.5%
]
10.25%
26,28422.1%
[
10.5%
-
11.0%
]
10.66%
15,33229.8%
[
11.0%
-
11.5%
]
11.10%
5,86538.7%
[
11.5%
-
12.0%
]
11.87%
8,39332.9%
[
12.0%
-
12.5%
]
12.10%
1,63790.1%
[
12.5%
-
13.0%
]
12.90%
5275.9%
[
13.0%
-
13.5%
]
13.25%
8,74076.3%
[
13.5%
-
14.0%
]
13.69%
9,90674.7%
[
14.0%
-
14.5%
]
14.23%
12,45917.3%
[
14.5%
-
15.0%
]
14.80%
22362.5%
[
15.0%
-
15.5%
]
15.17%
3,31544.4%
[
15.5%
-
16.0%
]
15.90%
3,2384.1%
[
16.0%
-
16.5%
]
16.34%
4,29733.4%
[
16.5%
-
17.0%
]
16.91%
2,42411.7%
[
17.0%
-
17.5%
]
17.25%
4,21438.2%
[
17.5%
-
18.0%
]
17.56%
4,57349.7%
[
18.0%
-
18.5%
]
18.30%
1,62837.0%
[
18.5%
-
19.0%
]
18.63%
1,69671.3%
[
21.0%
-
21.5%
]
21.21%
363100.0%
[
21.5%
-
22.0%
]
21.73%
93934.7%
[
22.5%
-
23.0%
]
22.71%
96093.5%
[
24.5%
-
25.0%
]
24.88%
1,51533.3%
[
25.5%
-
26.0%
]
25.79%
57030.1%
[
30.0%
-
30.5%
]
30.28%
885100.0%
[
34.0%
-
34.5%
]
34.22%
450100.0%
[
36.0%
-
36.5%
]
36.40%
72815.0%
[
38.0%
-
38.5%
]
38.18%
55100.0%
[
53.5%
-
54.0%
]
53.51%
299100.0%