Scotch-Irish Unemployment Among Women with Children Ages 6 to 17 years
COMPARE
Scotch-Irish
Select to Compare
Unemployment Among Women with Children Ages 6 to 17 years
Scotch-Irish Unemployment Among Women with Children Ages 6 to 17 years
9.7%
UNEMPLOYMENT | WOMEN W/ CHILDREN 6 TO 17
0.1/ 100
METRIC RATING
279th/ 347
METRIC RANK
Scotch-Irish Unemployment Among Women with Children Ages 6 to 17 years Correlation Chart
The statistical analysis conducted on geographies consisting of 346,014,789 people shows a strong positive correlation between the proportion of Scotch-Irish and unemployment rate among women with children between the ages 6 and 17 in the United States with a correlation coefficient (R) of 0.730 and weighted average of 9.7%. On average, for every 1% (one percent) increase in Scotch-Irish within a typical geography, there is an increase of 2.6% in unemployment rate among women with children between the ages 6 and 17.
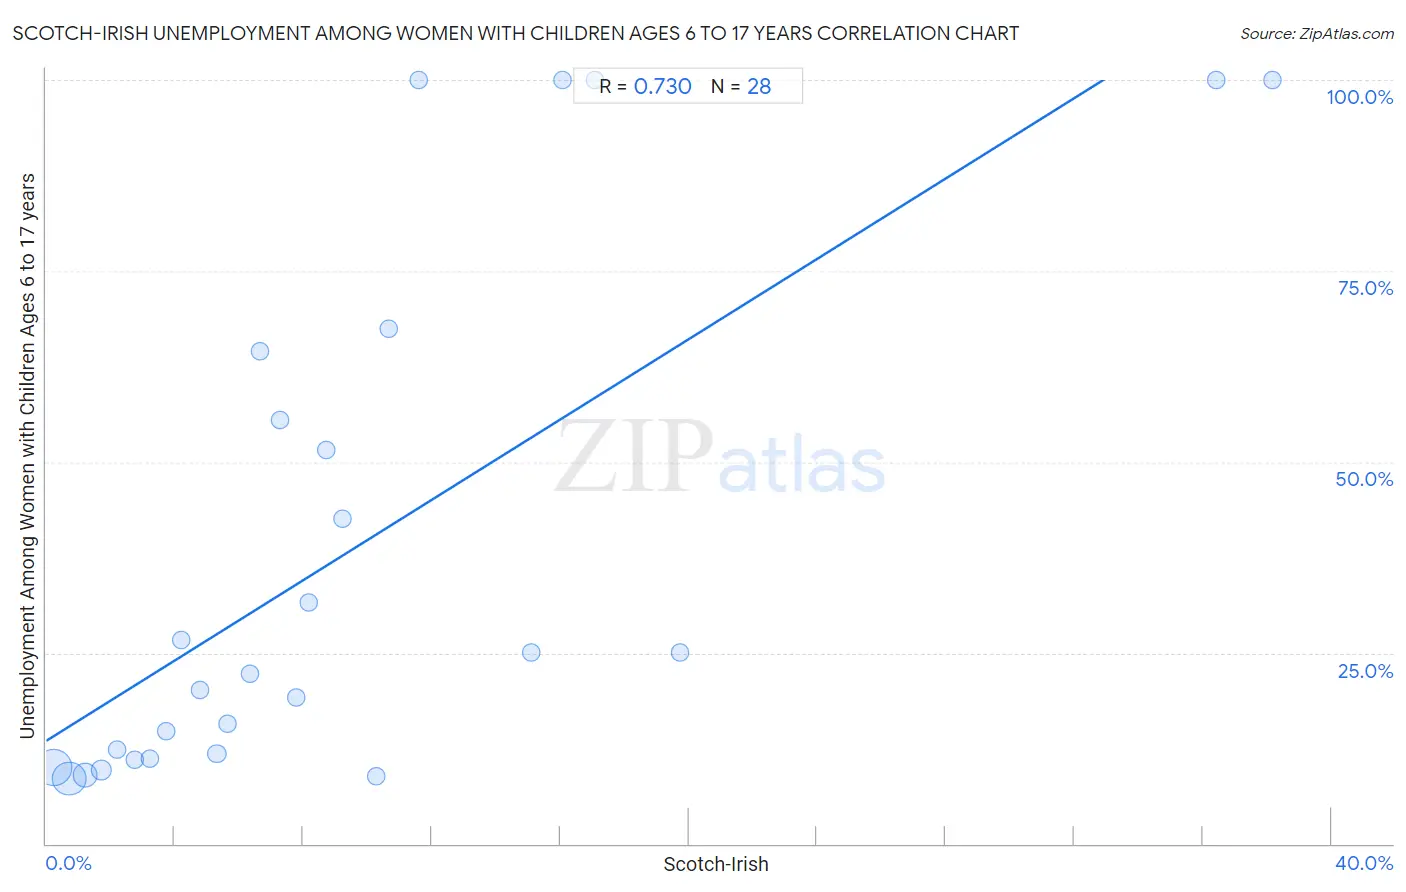
It is essential to understand that the correlation between the percentage of Scotch-Irish and unemployment rate among women with children between the ages 6 and 17 does not imply a direct cause-and-effect relationship. It remains uncertain whether the presence of Scotch-Irish influences an upward or downward trend in the level of unemployment rate among women with children between the ages 6 and 17 within an area, or if Scotch-Irish simply ended up residing in those areas with higher or lower levels of unemployment rate among women with children between the ages 6 and 17 due to other factors.
Demographics Similar to Scotch-Irish by Unemployment Among Women with Children Ages 6 to 17 years
In terms of unemployment among women with children ages 6 to 17 years, the demographic groups most similar to Scotch-Irish are French (9.7%, a difference of 0.030%), British West Indian (9.7%, a difference of 0.11%), Immigrants from Portugal (9.7%, a difference of 0.16%), U.S. Virgin Islander (9.7%, a difference of 0.17%), and Seminole (9.7%, a difference of 0.19%).
| Demographics | Rating | Rank | Unemployment Among Women with Children Ages 6 to 17 years |
| Kiowa | 0.1 /100 | #272 | Tragic 9.6% |
| Whites/Caucasians | 0.1 /100 | #273 | Tragic 9.6% |
| Aleuts | 0.1 /100 | #274 | Tragic 9.6% |
| U.S. Virgin Islanders | 0.1 /100 | #275 | Tragic 9.7% |
| Immigrants from Portugal | 0.1 /100 | #276 | Tragic 9.7% |
| British West Indians | 0.1 /100 | #277 | Tragic 9.7% |
| French | 0.1 /100 | #278 | Tragic 9.7% |
| Scotch-Irish | 0.1 /100 | #279 | Tragic 9.7% |
| Seminole | 0.1 /100 | #280 | Tragic 9.7% |
| Jamaicans | 0.0 /100 | #281 | Tragic 9.8% |
| Slovaks | 0.0 /100 | #282 | Tragic 9.8% |
| Central American Indians | 0.0 /100 | #283 | Tragic 9.9% |
| Yakama | 0.0 /100 | #284 | Tragic 9.9% |
| Hispanics or Latinos | 0.0 /100 | #285 | Tragic 9.9% |
| Choctaw | 0.0 /100 | #286 | Tragic 9.9% |
Scotch-Irish Unemployment Among Women with Children Ages 6 to 17 years Correlation Summary
| Measurement | Scotch-Irish Data | Unemployment Among Women with Children Ages 6 to 17 years Data |
| Minimum | 0.24% | 8.6% |
| Maximum | 38.2% | 100.0% |
| Range | 37.9% | 91.4% |
| Mean | 9.5% | 38.4% |
| Median | 7.0% | 23.6% |
| Interquartile 25% (IQ1) | 3.5% | 11.4% |
| Interquartile 75% (IQ3) | 11.1% | 60.0% |
| Interquartile Range (IQR) | 7.6% | 48.6% |
| Standard Deviation (Sample) | 9.4% | 33.7% |
| Standard Deviation (Population) | 9.2% | 33.1% |
Correlation Details
| Scotch-Irish Percentile | Sample Size | Unemployment Among Women with Children Ages 6 to 17 years |
[ 0.0% - 0.5% ] 0.24% | 146,669,284 | 10.0% |
[ 0.5% - 1.0% ] 0.72% | 120,155,683 | 8.6% |
[ 1.0% - 1.5% ] 1.20% | 46,870,638 | 9.0% |
[ 1.5% - 2.0% ] 1.71% | 18,630,487 | 9.6% |
[ 2.0% - 2.5% ] 2.21% | 6,614,928 | 12.3% |
[ 2.5% - 3.0% ] 2.74% | 3,602,050 | 11.0% |
[ 3.0% - 3.5% ] 3.23% | 1,913,068 | 11.1% |
[ 3.5% - 4.0% ] 3.72% | 789,857 | 14.8% |
[ 4.0% - 4.5% ] 4.21% | 311,838 | 26.6% |
[ 4.5% - 5.0% ] 4.79% | 135,604 | 20.1% |
[ 5.0% - 5.5% ] 5.31% | 157,648 | 11.8% |
[ 5.5% - 6.0% ] 5.62% | 65,996 | 15.7% |
[ 6.0% - 6.5% ] 6.36% | 34,239 | 22.2% |
[ 6.5% - 7.0% ] 6.66% | 9,596 | 64.5% |
[ 7.0% - 7.5% ] 7.28% | 9,815 | 55.5% |
[ 7.5% - 8.0% ] 7.77% | 3,049 | 19.2% |
[ 8.0% - 8.5% ] 8.17% | 12,882 | 31.7% |
[ 8.5% - 9.0% ] 8.71% | 5,705 | 51.5% |
[ 9.0% - 9.5% ] 9.23% | 9,535 | 42.5% |
[ 10.0% - 10.5% ] 10.28% | 9,257 | 8.8% |
[ 10.5% - 11.0% ] 10.66% | 769 | 67.4% |
[ 11.5% - 12.0% ] 11.59% | 397 | 100.0% |
[ 15.0% - 15.5% ] 15.09% | 285 | 25.0% |
[ 16.0% - 16.5% ] 16.07% | 305 | 100.0% |
[ 17.0% - 17.5% ] 17.09% | 117 | 100.0% |
[ 19.5% - 20.0% ] 19.71% | 974 | 25.0% |
[ 36.0% - 36.5% ] 36.40% | 728 | 100.0% |
[ 38.0% - 38.5% ] 38.18% | 55 | 100.0% |