Lebanese Self-Care Disability
COMPARE
Lebanese
Select to Compare
Self-Care Disability
Lebanese Self-Care Disability
2.4%
SELF-CARE DISABILITY
66.5/ 100
METRIC RATING
161st/ 347
METRIC RANK
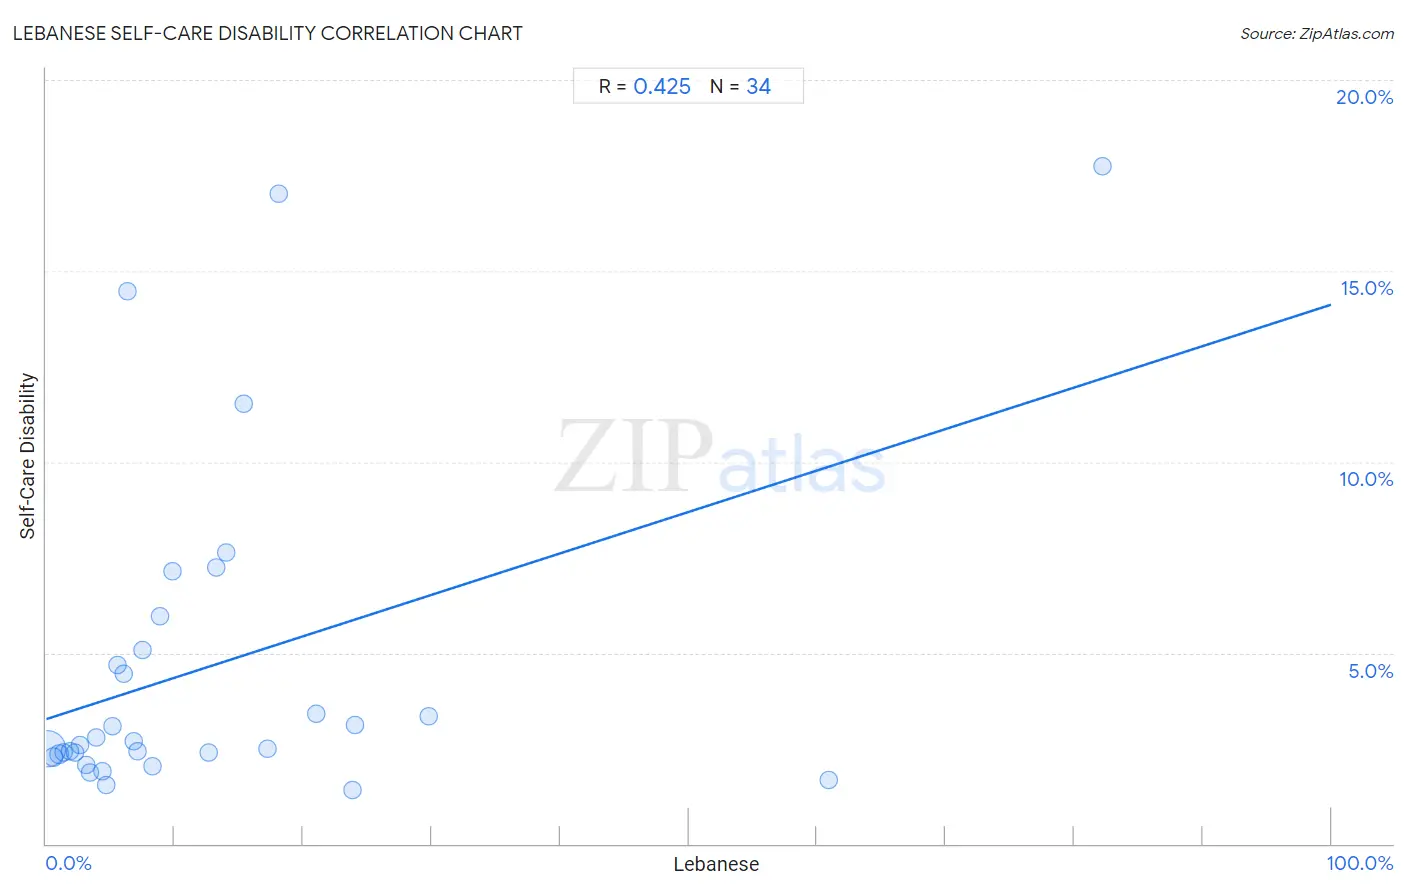
Lebanese Self-Care Disability Correlation Chart
The statistical analysis conducted on geographies consisting of 401,146,528 people shows a moderate positive correlation between the proportion of Lebanese and percentage of population with self-care disability in the United States with a correlation coefficient (R) of 0.425 and weighted average of 2.4%. On average, for every 1% (one percent) increase in Lebanese within a typical geography, there is an increase of 0.11% in percentage of population with self-care disability.
It is essential to understand that the correlation between the percentage of Lebanese and percentage of population with self-care disability does not imply a direct cause-and-effect relationship. It remains uncertain whether the presence of Lebanese influences an upward or downward trend in the level of percentage of population with self-care disability within an area, or if Lebanese simply ended up residing in those areas with higher or lower levels of percentage of population with self-care disability due to other factors.
Demographics Similar to Lebanese by Self-Care Disability
In terms of self-care disability, the demographic groups most similar to Lebanese are Finnish (2.4%, a difference of 0.030%), Immigrants from Western Europe (2.4%, a difference of 0.11%), Immigrants from Italy (2.4%, a difference of 0.11%), Somali (2.5%, a difference of 0.14%), and Immigrants from Europe (2.4%, a difference of 0.17%).
| Demographics | Rating | Rank | Self-Care Disability |
| Italians | 72.2 /100 | #154 | Good 2.4% |
| Pakistanis | 71.4 /100 | #155 | Good 2.4% |
| Nigerians | 70.6 /100 | #156 | Good 2.4% |
| Immigrants from Europe | 69.6 /100 | #157 | Good 2.4% |
| Immigrants from Western Europe | 68.6 /100 | #158 | Good 2.4% |
| Immigrants from Italy | 68.5 /100 | #159 | Good 2.4% |
| Finns | 67.0 /100 | #160 | Good 2.4% |
| Lebanese | 66.5 /100 | #161 | Good 2.4% |
| Somalis | 63.7 /100 | #162 | Good 2.5% |
| German Russians | 62.7 /100 | #163 | Good 2.5% |
| Immigrants from Vietnam | 59.3 /100 | #164 | Average 2.5% |
| Syrians | 59.0 /100 | #165 | Average 2.5% |
| Canadians | 58.8 /100 | #166 | Average 2.5% |
| Immigrants from Greece | 57.3 /100 | #167 | Average 2.5% |
| Ute | 57.1 /100 | #168 | Average 2.5% |
Lebanese Self-Care Disability Correlation Summary
| Measurement | Lebanese Data | Self-Care Disability Data |
| Minimum | 0.14% | 1.4% |
| Maximum | 82.2% | 17.8% |
| Range | 82.1% | 16.4% |
| Mean | 12.7% | 4.6% |
| Median | 6.9% | 2.6% |
| Interquartile 25% (IQ1) | 3.4% | 2.3% |
| Interquartile 75% (IQ3) | 15.4% | 5.1% |
| Interquartile Range (IQR) | 12.0% | 2.7% |
| Standard Deviation (Sample) | 16.9% | 4.3% |
| Standard Deviation (Population) | 16.7% | 4.3% |
Correlation Details
| Lebanese Percentile | Sample Size | Self-Care Disability |
[ 0.0% - 0.5% ] 0.14% | 348,386,077 | 2.5% |
[ 0.5% - 1.0% ] 0.55% | 37,579,645 | 2.3% |
[ 0.5% - 1.0% ] 0.99% | 8,796,045 | 2.3% |
[ 1.0% - 1.5% ] 1.39% | 3,351,975 | 2.4% |
[ 1.5% - 2.0% ] 1.83% | 1,212,106 | 2.4% |
[ 2.0% - 2.5% ] 2.21% | 618,893 | 2.4% |
[ 2.5% - 3.0% ] 2.60% | 423,086 | 2.6% |
[ 3.0% - 3.5% ] 3.10% | 157,733 | 2.1% |
[ 3.0% - 3.5% ] 3.42% | 81,773 | 1.9% |
[ 3.5% - 4.0% ] 3.90% | 131,289 | 2.8% |
[ 4.0% - 4.5% ] 4.35% | 13,712 | 1.9% |
[ 4.5% - 5.0% ] 4.70% | 18,603 | 1.6% |
[ 5.0% - 5.5% ] 5.16% | 29,988 | 3.1% |
[ 5.5% - 6.0% ] 5.51% | 10,451 | 4.7% |
[ 6.0% - 6.5% ] 6.02% | 664 | 4.4% |
[ 6.0% - 6.5% ] 6.36% | 1,054 | 14.5% |
[ 6.5% - 7.0% ] 6.78% | 8,720 | 2.7% |
[ 7.0% - 7.5% ] 7.08% | 7,982 | 2.4% |
[ 7.5% - 8.0% ] 7.52% | 1,277 | 5.1% |
[ 8.0% - 8.5% ] 8.31% | 34,371 | 2.0% |
[ 8.5% - 9.0% ] 8.88% | 169 | 6.0% |
[ 9.5% - 10.0% ] 9.82% | 112 | 7.1% |
[ 12.5% - 13.0% ] 12.67% | 2,359 | 2.4% |
[ 13.0% - 13.5% ] 13.22% | 469 | 7.2% |
[ 13.5% - 14.0% ] 13.97% | 229 | 7.6% |
[ 15.0% - 15.5% ] 15.38% | 156 | 11.5% |
[ 17.0% - 17.5% ] 17.21% | 108,414 | 2.5% |
[ 18.0% - 18.5% ] 18.09% | 94 | 17.0% |
[ 21.0% - 21.5% ] 21.06% | 62,474 | 3.4% |
[ 23.5% - 24.0% ] 23.82% | 12,405 | 1.4% |
[ 24.0% - 24.5% ] 24.07% | 53,044 | 3.1% |
[ 29.5% - 30.0% ] 29.74% | 40,392 | 3.3% |
[ 60.5% - 61.0% ] 60.91% | 660 | 1.7% |
[ 82.0% - 82.5% ] 82.24% | 107 | 17.8% |