Swiss Self-Care Disability

COMPARE

Swiss
Race
Ancestry
AfghanAfricanAlaska NativeAlaskan AthabascanAlbanianAleutAlsatianAmericanApacheArabArapahoArgentineanArmenianAssyrian/Chaldean/SyriacAustralianAustrianBahamianBangladeshiBarbadianBasqueBelgianBelizeanBermudanBhutaneseBlackfeetBolivianBrazilianBritishBritish West IndianBulgarianBurmeseCajunCambodianCanadianCape VerdeanCarpatho RusynCelticCentral AmericanCentral American IndianCherokeeCheyenneChickasawChileanChineseChippewaChoctawColombianColvilleComancheCosta RicanCreeCreekCroatianCrowCubanCypriotCzechCzechoslovakianDanishDelawareDominicanDutchDutch West IndianEastern EuropeanEcuadorianEgyptianEnglishEstonianEthiopianEuropeanFijianFilipinoFinnishFrenchFrench American IndianFrench CanadianGermanGerman RussianGhanaianGreekGuamanian/ChamorroGuatemalanGuyaneseHaitianHmongHonduranHopiHoumaHungarianIcelanderIndian (Asian)IndonesianInupiatIranianIraqiIrishIroquoisIsraeliItalianJamaicanJapaneseJordanianKenyanKiowaKoreanLaotianLatvianLebaneseLiberianLithuanianLumbeeLuxembourgerMacedonianMalaysianMalteseMarshalleseMenomineeMexicanMexican American IndianMongolianMoroccanNative HawaiianNavajoNepaleseNew ZealanderNicaraguanNigerianNorthern EuropeanNorwegianOkinawanOsageOttawaPaiutePakistaniPalestinianPanamanianParaguayanPennsylvania GermanPeruvianPimaPolishPortuguesePotawatomiPuebloPuerto RicanPuget Sound SalishRomanianRussianSalvadoranSamoanScandinavianScotch-IrishScottishSeminoleSenegaleseSerbianShoshoneSierra LeoneanSiouxSlavicSlovakSloveneSomaliSouth AfricanSouth AmericanSouth American IndianSoviet UnionSpaniardSpanishSpanish AmericanSpanish American IndianSri LankanSubsaharan AfricanSudaneseSwedishSwissSyrianTaiwaneseThaiTlingit-HaidaTohono O'OdhamTonganTrinidadian and TobagonianTsimshianTurkishU.S. Virgin IslanderUgandanUkrainianUruguayanUteVenezuelanVietnameseWelshWest IndianYakamaYaquiYugoslavianYumanYup'ikZimbabwean
Immigration
NonimmigrantsImmigrantsAfghanistanAfricaAlbaniaArgentinaArmeniaAsiaAustraliaAustriaBahamasBangladeshBarbadosBelarusBelgiumBelizeBoliviaBosnia and HerzegovinaBrazilBulgariaBurma/MyanmarCabo VerdeCambodiaCameroonCanadaCaribbeanCentral AmericaChileChinaColombiaCongoCosta RicaCroatiaCubaCzechoslovakiaDenmarkDominicaDominican RepublicEastern AfricaEastern AsiaEastern EuropeEcuadorEgyptEl SalvadorEnglandEritreaEthiopiaEuropeFijiFranceGermanyGhanaGreeceGrenadaGuatemalaGuyanaHaitiHondurasHong KongHungaryIndiaIndonesiaIranIraqIrelandIsraelItalyJamaicaJapanJordanKazakhstanKenyaKoreaKuwaitLaosLatin AmericaLatviaLebanonLiberiaLithuaniaMalaysiaMexicoMicronesiaMiddle AfricaMoldovaMoroccoNepalNetherlandsNicaraguaNigeriaNorth AmericaNorth MacedoniaNorthern AfricaNorthern EuropeNorwayOceaniaPakistanPanamaPeruPhilippinesPolandPortugalRomaniaRussiaSaudi ArabiaScotlandSenegalSerbiaSierra LeoneSingaporeSomaliaSouth AfricaSouth AmericaSouth Central AsiaSouth Eastern AsiaSouthern EuropeSpainSri LankaSt. Vincent and the GrenadinesSudanSwedenSwitzerlandSyriaTaiwanThailandTrinidad and TobagoTurkeyUgandaUkraineUruguayUzbekistanVenezuelaVietnamWest IndiesWestern AfricaWestern AsiaWestern EuropeYemenZaireZimbabweAzores
Select to Compare
Race
Ancestry
AfghanAfricanAlaska NativeAlaskan AthabascanAlbanianAleutAlsatianAmericanApacheArabArapahoArgentineanArmenianAssyrian/Chaldean/SyriacAustralianAustrianBahamianBangladeshiBarbadianBasqueBelgianBelizeanBermudanBhutaneseBlackfeetBolivianBrazilianBritishBritish West IndianBulgarianBurmeseCajunCambodianCanadianCape VerdeanCarpatho RusynCelticCentral AmericanCentral American IndianCherokeeCheyenneChickasawChileanChineseChippewaChoctawColombianColvilleComancheCosta RicanCreeCreekCroatianCrowCubanCypriotCzechCzechoslovakianDanishDelawareDominicanDutchDutch West IndianEastern EuropeanEcuadorianEgyptianEnglishEstonianEthiopianEuropeanFijianFilipinoFinnishFrenchFrench American IndianFrench CanadianGermanGerman RussianGhanaianGreekGuamanian/ChamorroGuatemalanGuyaneseHaitianHmongHonduranHopiHoumaHungarianIcelanderIndian (Asian)IndonesianInupiatIranianIraqiIrishIroquoisIsraeliItalianJamaicanJapaneseJordanianKenyanKiowaKoreanLaotianLatvianLebaneseLiberianLithuanianLumbeeLuxembourgerMacedonianMalaysianMalteseMarshalleseMenomineeMexicanMexican American IndianMongolianMoroccanNative HawaiianNavajoNepaleseNew ZealanderNicaraguanNigerianNorthern EuropeanNorwegianOkinawanOsageOttawaPaiutePakistaniPalestinianPanamanianParaguayanPennsylvania GermanPeruvianPimaPolishPortuguesePotawatomiPuebloPuerto RicanPuget Sound SalishRomanianRussianSalvadoranSamoanScandinavianScotch-IrishScottishSeminoleSenegaleseSerbianShoshoneSierra LeoneanSiouxSlavicSlovakSloveneSomaliSouth AfricanSouth AmericanSouth American IndianSoviet UnionSpaniardSpanishSpanish AmericanSpanish American IndianSri LankanSubsaharan AfricanSudaneseSwedishSyrianTaiwaneseThaiTlingit-HaidaTohono O'OdhamTonganTrinidadian and TobagonianTsimshianTurkishU.S. Virgin IslanderUgandanUkrainianUruguayanUteVenezuelanVietnameseWelshWest IndianYakamaYaquiYugoslavianYumanYup'ikZimbabwean
Immigration
NonimmigrantsImmigrantsAfghanistanAfricaAlbaniaArgentinaArmeniaAsiaAustraliaAustriaBahamasBangladeshBarbadosBelarusBelgiumBelizeBoliviaBosnia and HerzegovinaBrazilBulgariaBurma/MyanmarCabo VerdeCambodiaCameroonCanadaCaribbeanCentral AmericaChileChinaColombiaCongoCosta RicaCroatiaCubaCzechoslovakiaDenmarkDominicaDominican RepublicEastern AfricaEastern AsiaEastern EuropeEcuadorEgyptEl SalvadorEnglandEritreaEthiopiaEuropeFijiFranceGermanyGhanaGreeceGrenadaGuatemalaGuyanaHaitiHondurasHong KongHungaryIndiaIndonesiaIranIraqIrelandIsraelItalyJamaicaJapanJordanKazakhstanKenyaKoreaKuwaitLaosLatin AmericaLatviaLebanonLiberiaLithuaniaMalaysiaMexicoMicronesiaMiddle AfricaMoldovaMoroccoNepalNetherlandsNicaraguaNigeriaNorth AmericaNorth MacedoniaNorthern AfricaNorthern EuropeNorwayOceaniaPakistanPanamaPeruPhilippinesPolandPortugalRomaniaRussiaSaudi ArabiaScotlandSenegalSerbiaSierra LeoneSingaporeSomaliaSouth AfricaSouth AmericaSouth Central AsiaSouth Eastern AsiaSouthern EuropeSpainSri LankaSt. Vincent and the GrenadinesSudanSwedenSwitzerlandSyriaTaiwanThailandTrinidad and TobagoTurkeyUgandaUkraineUruguayUzbekistanVenezuelaVietnamWest IndiesWestern AfricaWestern AsiaWestern EuropeYemenZaireZimbabweAzores
Self-Care Disability
Income
Poverty
Unemployment
Labor Participation
Family Structure
Vehicle Availability
Education Level
Disability

Swiss Self-Care Disability
Exceptional

2.4%
SELF-CARE DISABILITY
96.6/ 100
METRIC RATING
97th/ 347
METRIC RANK

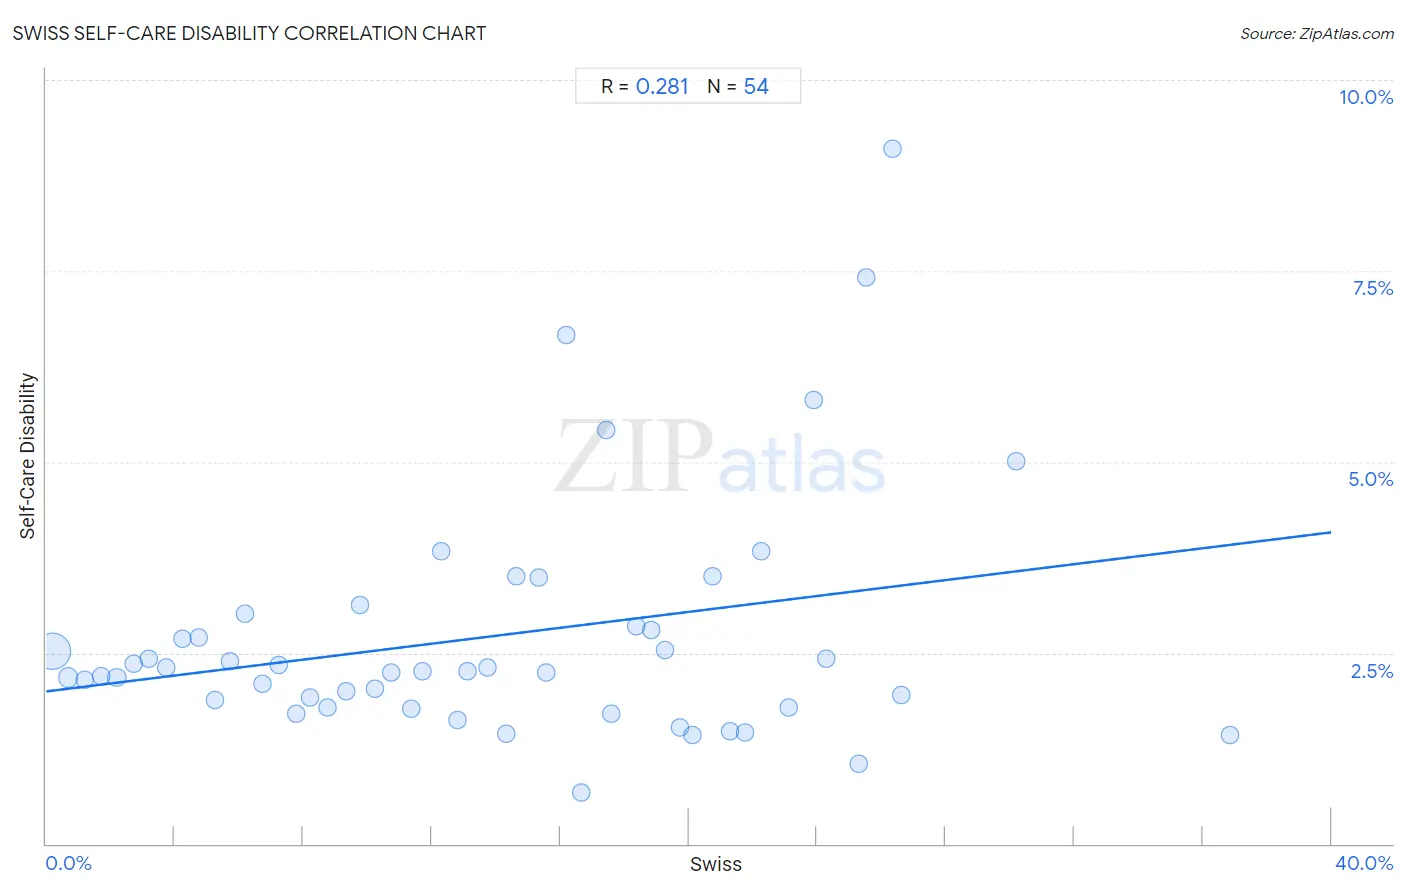
Swiss Self-Care Disability Correlation Chart

The statistical analysis conducted on geographies consisting of 464,154,677 people shows a weak positive correlation between the proportion of Swiss and percentage of population with self-care disability in the United States with a correlation coefficient (R) of 0.281 and weighted average of 2.4%. On average, for every 1% (one percent) increase in Swiss within a typical geography, there is an increase of 0.052% in percentage of population with self-care disability.
Swiss Self-Care Disability
It is essential to understand that the correlation between the percentage of Swiss and percentage of population with self-care disability does not imply a direct cause-and-effect relationship. It remains uncertain whether the presence of Swiss influences an upward or downward trend in the level of percentage of population with self-care disability within an area, or if Swiss simply ended up residing in those areas with higher or lower levels of percentage of population with self-care disability due to other factors.

Demographics Similar to Swiss by Self-Care Disability

In terms of self-care disability, the demographic groups most similar to Swiss are Immigrants from Chile (2.4%, a difference of 0.040%), Immigrants from Poland (2.4%, a difference of 0.090%), Immigrants from Asia (2.4%, a difference of 0.10%), Macedonian (2.4%, a difference of 0.11%), and Immigrants from Latvia (2.4%, a difference of 0.16%).
DemographicsRating | RankSelf-Care Disability
Immigrants from Czechoslovakia
97.7
/100
|
#90
Exceptional
2.4%
Immigrants from Jordan
97.7
/100
|
#91
Exceptional
2.4%
Icelanders
97.4
/100
|
#92
Exceptional
2.4%
Immigrants from Latvia
97.0
/100
|
#93
Exceptional
2.4%
Macedonians
96.9
/100
|
#94
Exceptional
2.4%
Immigrants from Asia
96.9
/100
|
#95
Exceptional
2.4%
Immigrants from Chile
96.7
/100
|
#96
Exceptional
2.4%
Swiss
96.6
/100
|
#97
Exceptional
2.4%
Immigrants from Poland
96.4
/100
|
#98
Exceptional
2.4%
Immigrants from Israel
96.1
/100
|
#99
Exceptional
2.4%
Europeans
95.8
/100
|
#100
Exceptional
2.4%
Immigrants from Scotland
95.7
/100
|
#101
Exceptional
2.4%
Croatians
95.0
/100
|
#102
Exceptional
2.4%
Alsatians
94.9
/100
|
#103
Exceptional
2.4%
Bhutanese
94.5
/100
|
#104
Exceptional
2.4%

Swiss Self-Care Disability Correlation Summary

MeasurementSwiss DataSelf-Care Disability Data
Minimum0.18%0.66%
Maximum36.9%9.1%
Range36.7%8.4%
Mean13.8%2.7%
Median13.4%2.3%
Interquartile 25% (IQ1)6.7%1.8%
Interquartile 75% (IQ3)20.1%2.9%
Interquartile Range (IQR)13.4%1.1%
Standard Deviation (Sample)8.6%1.6%
Standard Deviation (Population)8.5%1.6%

Correlation Details

Swiss PercentileSample SizeSelf-Care Disability
[
0.0%
-
0.5%
]
0.18%
392,787,4202.5%
[
0.5%
-
1.0%
]
0.68%
51,712,3032.2%
[
1.0%
-
1.5%
]
1.21%
10,630,2392.1%
[
1.5%
-
2.0%
]
1.70%
3,689,3612.2%
[
2.0%
-
2.5%
]
2.20%
1,666,6852.2%
[
2.5%
-
3.0%
]
2.72%
1,133,7522.4%
[
3.0%
-
3.5%
]
3.20%
657,3812.4%
[
3.5%
-
4.0%
]
3.72%
421,7652.3%
[
4.0%
-
4.5%
]
4.24%
240,9982.7%
[
4.5%
-
5.0%
]
4.74%
203,1702.7%
[
5.0%
-
5.5%
]
5.25%
132,4261.9%
[
5.5%
-
6.0%
]
5.72%
188,5772.4%
[
6.0%
-
6.5%
]
6.20%
125,8383.0%
[
6.5%
-
7.0%
]
6.75%
61,7792.1%
[
7.0%
-
7.5%
]
7.26%
111,0082.3%
[
7.5%
-
8.0%
]
7.80%
28,7841.7%
[
8.0%
-
8.5%
]
8.22%
36,8531.9%
[
8.5%
-
9.0%
]
8.74%
32,5051.8%
[
9.0%
-
9.5%
]
9.35%
39,6852.0%
[
9.5%
-
10.0%
]
9.76%
23,9653.1%
[
10.0%
-
10.5%
]
10.22%
8,0442.0%
[
10.5%
-
11.0%
]
10.72%
37,0532.2%
[
11.0%
-
11.5%
]
11.35%
29,8851.8%
[
11.5%
-
12.0%
]
11.72%
8,2152.3%
[
12.0%
-
12.5%
]
12.28%
10,7193.8%
[
12.5%
-
13.0%
]
12.79%
9,7041.6%
[
13.0%
-
13.5%
]
13.10%
8,7282.3%
[
13.5%
-
14.0%
]
13.73%
10,8632.3%
[
14.0%
-
14.5%
]
14.30%
6,2991.4%
[
14.5%
-
15.0%
]
14.62%
8,9293.5%
[
15.0%
-
15.5%
]
15.31%
9,7773.5%
[
15.5%
-
16.0%
]
15.56%
4,6982.2%
[
16.0%
-
16.5%
]
16.17%
2,0476.7%
[
16.5%
-
17.0%
]
16.67%
8,6270.66%
[
17.0%
-
17.5%
]
17.44%
4075.4%
[
17.5%
-
18.0%
]
17.57%
3,3121.7%
[
18.0%
-
18.5%
]
18.36%
12,6062.9%
[
18.5%
-
19.0%
]
18.82%
15,1652.8%
[
19.0%
-
19.5%
]
19.26%
2,9652.5%
[
19.5%
-
20.0%
]
19.73%
12,4881.5%
[
20.0%
-
20.5%
]
20.11%
4,8931.4%
[
20.5%
-
21.0%
]
20.74%
2,4303.5%
[
21.0%
-
21.5%
]
21.28%
8601.5%
[
21.5%
-
22.0%
]
21.75%
3,2511.5%
[
22.0%
-
22.5%
]
22.26%
3283.8%
[
23.0%
-
23.5%
]
23.12%
1,5141.8%
[
23.5%
-
24.0%
]
23.91%
2,1545.8%
[
24.0%
-
24.5%
]
24.27%
3422.4%
[
25.0%
-
25.5%
]
25.29%
6011.0%
[
25.5%
-
26.0%
]
25.53%
1417.4%
[
26.0%
-
26.5%
]
26.34%
9919.1%
[
26.5%
-
27.0%
]
26.61%
1,1351.9%
[
30.0%
-
30.5%
]
30.19%
3615.0%
[
36.5%
-
37.0%
]
36.87%
6511.4%