Scotch-Irish Per Capita Income
COMPARE
Scotch-Irish
Select to Compare
Per Capita Income
Scotch-Irish Per Capita Income
$42,563
PER CAPITA INCOME
22.6/ 100
METRIC RATING
197th/ 347
METRIC RANK
Scotch-Irish Per Capita Income Correlation Chart
The statistical analysis conducted on geographies consisting of 548,816,006 people shows a weak negative correlation between the proportion of Scotch-Irish and per capita income in the United States with a correlation coefficient (R) of -0.238 and weighted average of $42,563. On average, for every 1% (one percent) increase in Scotch-Irish within a typical geography, there is a decrease of $157 in per capita income.
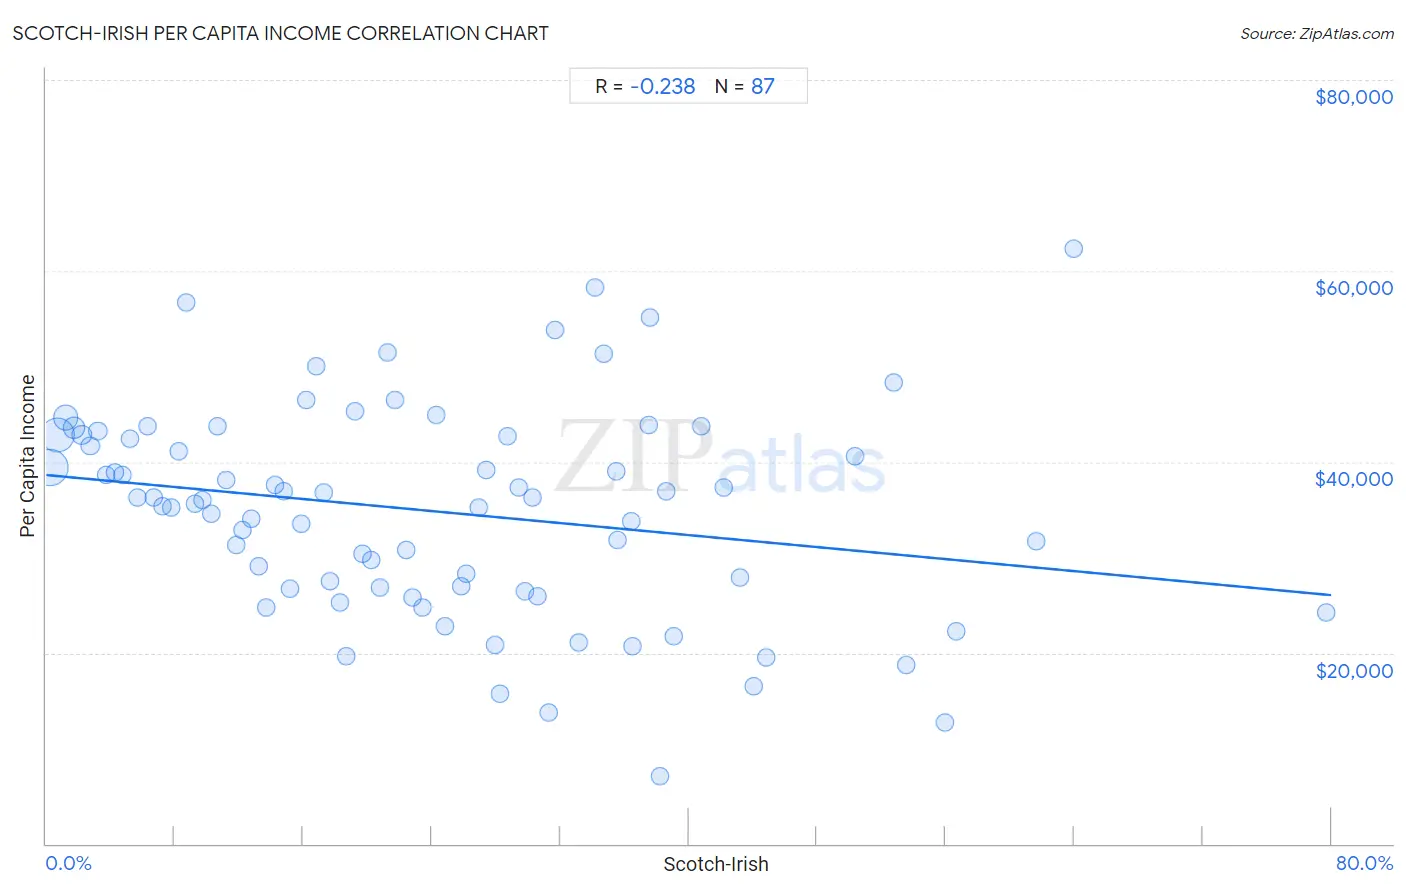
It is essential to understand that the correlation between the percentage of Scotch-Irish and per capita income does not imply a direct cause-and-effect relationship. It remains uncertain whether the presence of Scotch-Irish influences an upward or downward trend in the level of per capita income within an area, or if Scotch-Irish simply ended up residing in those areas with higher or lower levels of per capita income due to other factors.
Demographics Similar to Scotch-Irish by Per Capita Income
In terms of per capita income, the demographic groups most similar to Scotch-Irish are Dutch ($42,605, a difference of 0.10%), Immigrants from Kenya ($42,661, a difference of 0.23%), Immigrants from Fiji ($42,694, a difference of 0.31%), Immigrants from Portugal ($42,412, a difference of 0.36%), and Barbadian ($42,406, a difference of 0.37%).
| Demographics | Rating | Rank | Per Capita Income |
| Kenyans | 27.7 /100 | #190 | Fair $42,808 |
| Yugoslavians | 27.4 /100 | #191 | Fair $42,792 |
| Iraqis | 26.7 /100 | #192 | Fair $42,760 |
| Immigrants from Sierra Leone | 26.5 /100 | #193 | Fair $42,752 |
| Immigrants from Fiji | 25.2 /100 | #194 | Fair $42,694 |
| Immigrants from Kenya | 24.5 /100 | #195 | Fair $42,661 |
| Dutch | 23.4 /100 | #196 | Fair $42,605 |
| Scotch-Irish | 22.6 /100 | #197 | Fair $42,563 |
| Immigrants from Portugal | 19.7 /100 | #198 | Poor $42,412 |
| Barbadians | 19.6 /100 | #199 | Poor $42,406 |
| Vietnamese | 19.0 /100 | #200 | Poor $42,368 |
| Immigrants from Thailand | 17.6 /100 | #201 | Poor $42,289 |
| Immigrants from Bosnia and Herzegovina | 17.5 /100 | #202 | Poor $42,278 |
| Spanish | 17.0 /100 | #203 | Poor $42,249 |
| Aleuts | 16.4 /100 | #204 | Poor $42,210 |
Scotch-Irish Per Capita Income Correlation Summary
| Measurement | Scotch-Irish Data | Per Capita Income Data |
| Minimum | 0.25% | $7,124 |
| Maximum | 79.7% | $62,377 |
| Range | 79.4% | $55,253 |
| Mean | 24.2% | $34,830 |
| Median | 21.7% | $35,981 |
| Interquartile 25% (IQ1) | 10.7% | $26,689 |
| Interquartile 75% (IQ3) | 35.5% | $42,802 |
| Interquartile Range (IQR) | 24.8% | $16,113 |
| Standard Deviation (Sample) | 16.7% | $10,987 |
| Standard Deviation (Population) | 16.6% | $10,923 |
Correlation Details
| Scotch-Irish Percentile | Sample Size | Per Capita Income |
[ 0.0% - 0.5% ] 0.25% | 210,836,542 | $39,374 |
[ 0.5% - 1.0% ] 0.72% | 183,306,926 | $42,802 |
[ 1.0% - 1.5% ] 1.21% | 82,723,326 | $44,594 |
[ 1.5% - 2.0% ] 1.72% | 36,479,384 | $43,550 |
[ 2.0% - 2.5% ] 2.21% | 15,924,288 | $42,865 |
[ 2.5% - 3.0% ] 2.73% | 7,866,836 | $41,700 |
[ 3.0% - 3.5% ] 3.23% | 5,139,772 | $43,195 |
[ 3.5% - 4.0% ] 3.75% | 2,465,049 | $38,671 |
[ 4.0% - 4.5% ] 4.25% | 1,280,222 | $38,923 |
[ 4.5% - 5.0% ] 4.76% | 753,049 | $38,635 |
[ 5.0% - 5.5% ] 5.23% | 645,455 | $42,435 |
[ 5.5% - 6.0% ] 5.71% | 328,314 | $36,322 |
[ 6.0% - 6.5% ] 6.29% | 211,860 | $43,715 |
[ 6.5% - 7.0% ] 6.71% | 140,328 | $36,217 |
[ 7.0% - 7.5% ] 7.24% | 123,134 | $35,364 |
[ 7.5% - 8.0% ] 7.78% | 113,646 | $35,195 |
[ 8.0% - 8.5% ] 8.22% | 77,398 | $41,065 |
[ 8.5% - 9.0% ] 8.75% | 61,743 | $56,644 |
[ 9.0% - 9.5% ] 9.25% | 40,511 | $35,579 |
[ 9.5% - 10.0% ] 9.76% | 39,379 | $35,981 |
[ 10.0% - 10.5% ] 10.27% | 39,547 | $34,595 |
[ 10.5% - 11.0% ] 10.70% | 27,649 | $43,756 |
[ 11.0% - 11.5% ] 11.24% | 20,175 | $38,061 |
[ 11.5% - 12.0% ] 11.80% | 18,678 | $31,296 |
[ 12.0% - 12.5% ] 12.23% | 9,506 | $32,829 |
[ 12.5% - 13.0% ] 12.75% | 5,191 | $34,096 |
[ 13.0% - 13.5% ] 13.22% | 19,170 | $29,117 |
[ 13.5% - 14.0% ] 13.70% | 16,987 | $24,727 |
[ 14.0% - 14.5% ] 14.26% | 16,611 | $37,585 |
[ 14.5% - 15.0% ] 14.82% | 3,732 | $36,955 |
[ 15.0% - 15.5% ] 15.17% | 6,541 | $26,689 |
[ 15.5% - 16.0% ] 15.86% | 5,689 | $33,548 |
[ 16.0% - 16.5% ] 16.20% | 11,312 | $46,527 |
[ 16.5% - 17.0% ] 16.81% | 5,258 | $50,031 |
[ 17.0% - 17.5% ] 17.25% | 8,190 | $36,854 |
[ 17.5% - 18.0% ] 17.66% | 9,676 | $27,446 |
[ 18.0% - 18.5% ] 18.30% | 2,300 | $25,325 |
[ 18.5% - 19.0% ] 18.65% | 3,018 | $19,664 |
[ 19.0% - 19.5% ] 19.19% | 2,356 | $45,310 |
[ 19.5% - 20.0% ] 19.72% | 1,359 | $30,375 |
[ 20.0% - 20.5% ] 20.26% | 770 | $29,684 |
[ 20.5% - 21.0% ] 20.75% | 3,046 | $26,899 |
[ 21.0% - 21.5% ] 21.24% | 1,356 | $51,466 |
[ 21.5% - 22.0% ] 21.70% | 1,972 | $46,424 |
[ 22.0% - 22.5% ] 22.39% | 67 | $30,715 |
[ 22.5% - 23.0% ] 22.77% | 1,458 | $25,820 |
[ 23.0% - 23.5% ] 23.41% | 1,072 | $24,714 |
[ 24.0% - 24.5% ] 24.31% | 288 | $44,927 |
[ 24.5% - 25.0% ] 24.86% | 1,943 | $22,734 |
[ 25.5% - 26.0% ] 25.83% | 724 | $26,921 |
[ 26.0% - 26.5% ] 26.17% | 405 | $28,315 |
[ 26.5% - 27.0% ] 26.91% | 431 | $35,200 |
[ 27.0% - 27.5% ] 27.42% | 383 | $39,103 |
[ 27.5% - 28.0% ] 27.93% | 179 | $20,820 |
[ 28.0% - 28.5% ] 28.26% | 92 | $15,752 |
[ 28.5% - 29.0% ] 28.75% | 473 | $42,642 |
[ 29.0% - 29.5% ] 29.40% | 500 | $37,255 |
[ 29.5% - 30.0% ] 29.83% | 905 | $26,489 |
[ 30.0% - 30.5% ] 30.25% | 3,223 | $36,267 |
[ 30.5% - 31.0% ] 30.57% | 386 | $25,926 |
[ 31.0% - 31.5% ] 31.25% | 32 | $13,709 |
[ 31.5% - 32.0% ] 31.65% | 79 | $53,857 |
[ 33.0% - 33.5% ] 33.12% | 157 | $21,083 |
[ 34.0% - 34.5% ] 34.17% | 1,080 | $58,234 |
[ 34.5% - 35.0% ] 34.73% | 357 | $51,387 |
[ 35.0% - 35.5% ] 35.46% | 141 | $38,988 |
[ 35.5% - 36.0% ] 35.54% | 166 | $31,873 |
[ 36.0% - 36.5% ] 36.40% | 728 | $33,834 |
[ 36.5% - 37.0% ] 36.53% | 605 | $20,743 |
[ 37.0% - 37.5% ] 37.50% | 72 | $43,914 |
[ 37.5% - 38.0% ] 37.58% | 157 | $55,148 |
[ 38.0% - 38.5% ] 38.18% | 55 | $7,124 |
[ 38.5% - 39.0% ] 38.60% | 171 | $36,954 |
[ 39.0% - 39.5% ] 39.08% | 87 | $21,757 |
[ 40.5% - 41.0% ] 40.78% | 103 | $43,763 |
[ 42.0% - 42.5% ] 42.19% | 64 | $37,356 |
[ 43.0% - 43.5% ] 43.17% | 556 | $27,872 |
[ 44.0% - 44.5% ] 44.08% | 338 | $16,469 |
[ 44.5% - 45.0% ] 44.84% | 339 | $19,532 |
[ 50.0% - 50.5% ] 50.34% | 149 | $40,606 |
[ 52.5% - 53.0% ] 52.73% | 55 | $48,285 |
[ 53.5% - 54.0% ] 53.51% | 299 | $18,754 |
[ 55.5% - 56.0% ] 55.93% | 59 | $12,720 |
[ 56.5% - 57.0% ] 56.63% | 83 | $22,273 |
[ 61.5% - 62.0% ] 61.67% | 60 | $31,713 |
[ 64.0% - 64.5% ] 64.00% | 175 | $62,377 |
[ 79.5% - 80.0% ] 79.66% | 59 | $24,163 |